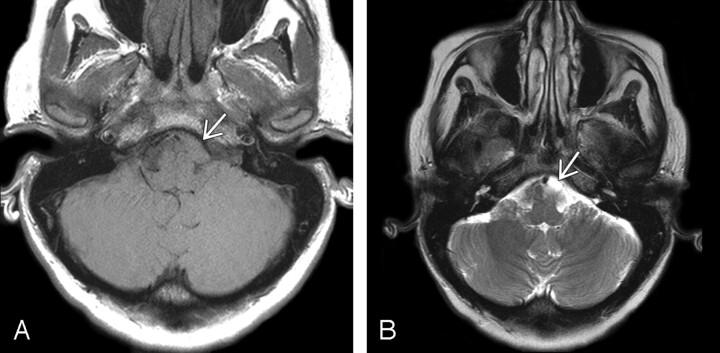
Fig 3.
Patient 3.
A, Axial T1-weighted demonstrates an ovoid mass (arrow) slightly to the left of midline at the level of the pontomedullary junction. It is hyperintense to CSF and isointense to the surrounding brain parenchyma.
B, Axial T2-weighted image in the same patient demonstrates that the cyst is isointense to slightly hyperintense compared with CSF (arrow). Imaging findings are typical for NE cyst.

