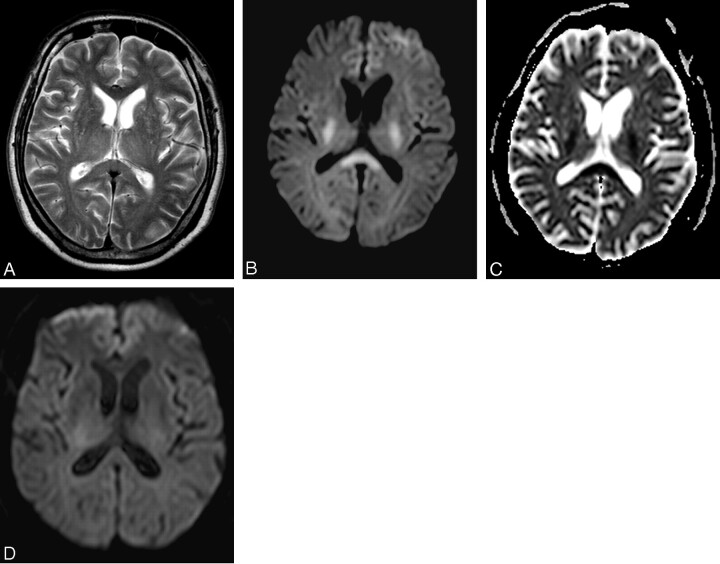
Fig 2.
Case 2, a 69-year-old diabetic man with atrial fibrillation who suddenly became unresponsive.
A, T2-weighted (3000/80 effective) MR image shows subtle increased intensity in the splenium of the corpus callosum (compared with the genu), posterior limbs of the internal capsules, and thalami bilaterally.
B, Corresponding diffusion-weighted (4200/95, b value 1000 seconds/mm2) MR image shows bilaterally symmetrical hyperintensities in the posterior limbs of the internal capsules and the splenium of the corpus callosum.
C, ADC map corresponding to B shows decreased ADC of the splenium of the corpus callosum (485 × 10−3 mm2/s) compared with the genu (890 × 10−3 mm2/s)
D, DW MR image 12 hours later shows complete normalization of previously noted lesions.

