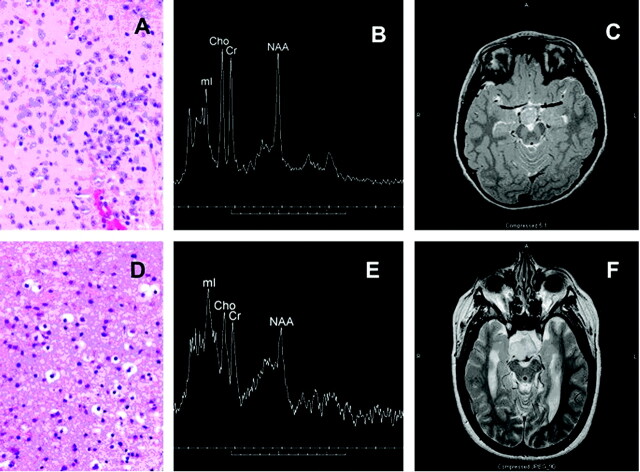
Fig 1.
Photomicrograph (H&E stain) from predominantly neuronal hypothalamic hamartoma (A) with corresponding single voxel MR spectrum (3T) and axial T2-weighted image (B, -C). The mI peak is moderately elevated and tumor is slightly hyperintense relative to gray matter on T2-weighted images. Also shown are a photomicrograph from a predominately glial hamartoma (D) with corresponding spectrum (1.5T) and T2-weighted images (E,-F). The mI peak is markedly elevated, and the lesion is very hyperintense in comparison to gray matter. Cho is mildly elevated, and NAA is reduced in both cases.

