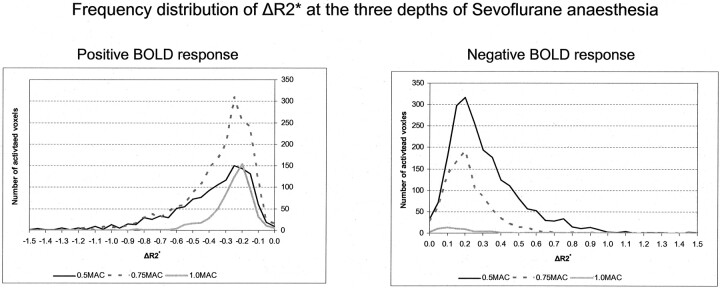
Fig 3.
The 2 panels show the frequency distribution of the peak ΔR2* at the 3 levels of sevoflurane anesthesia. Left, the frequency distribution for the positive BOLD response. Right, the frequency distribution of the negative BOLD response. We selected to show the absolute values for each bin, rather than the relative values, to convey to the reader the difference in the number of activated voxels upon which the distribution is based.

