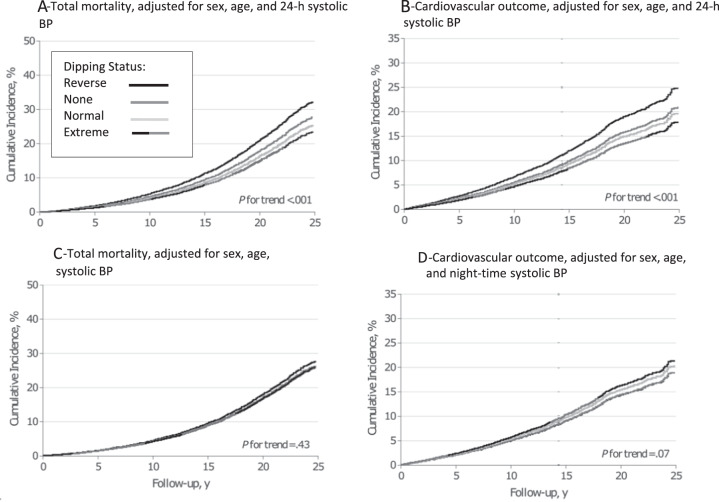
Fig. 5. Incidence of mortality and cardiovascular outcomes, adjusted for gender, age, nighttime and 24-h BP.
Shown is the incidence of mortality, adjusted for sex, age and 24-h systolic blood pressure (A), cardiovascular outcomes, adjusted for sex, age and 24-h systolic blood pressure (B), total mortality, adjusted for sex, age and night-time systolic blood pressure (C) and cardiovascular outcomes, adjusted for sex, age and night-time systolic blood pressure (D) over follow-up in years based on systolic dipping ratio [8].

