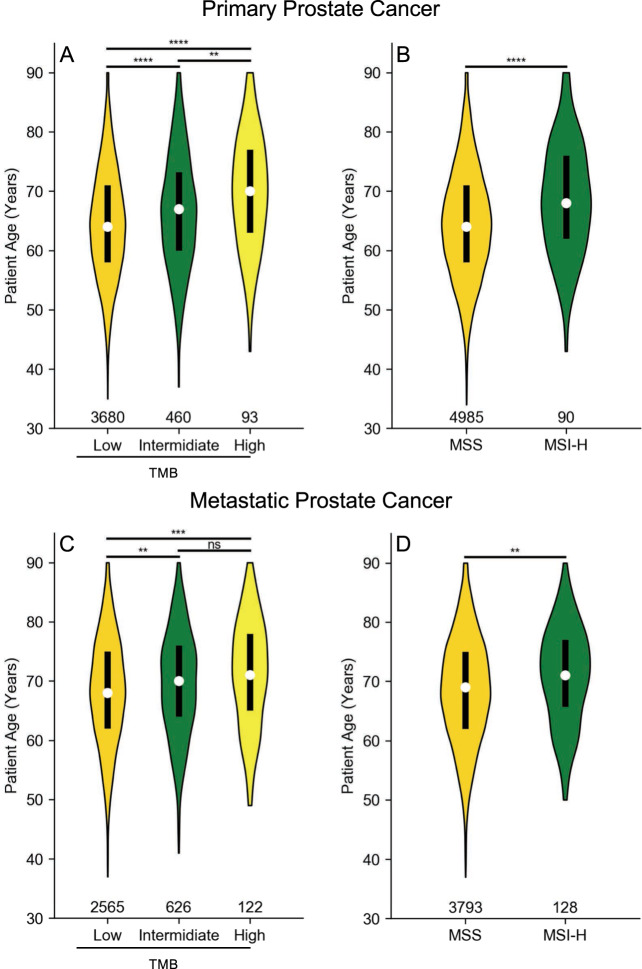
Fig. 5. Age-related variation of MSI and TMB status.
Samples from primary (A, B) and metastatic (C, D) prostate cancer are shown. The white point indicates median age, black box represents the interquartile range, and the violin shows age distribution for all patients of the indicated phenotype. Total number of patients shown along the x-axis. MSS microsatellite stable, MSI-H microsatellite-instable, TMB tumor mutational burden, low: TMB < 6, intermediate: 6 ≤ TMB < 20, high: TMB ≥ 20. Two-sided Student’s t test used to compare indicated groups: ns not significant; *p < 0.05; **p < 0.01; ***p < 0.001, ****p < 0.0001.

