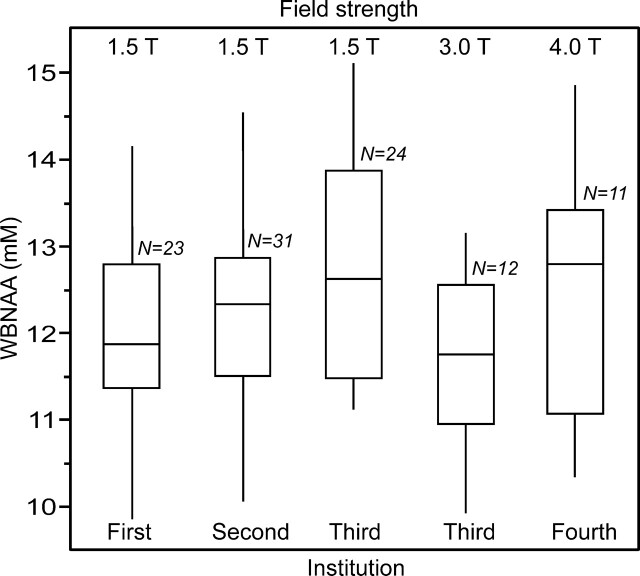
Fig 2.
Box plot showing the 25%, 50% (median), and 75% quartiles (box) and ±95% (whiskers), of the distributions of the subjects’ WBNAA concentrations in each of the 4 institutions, 5 scanners, 3 field strengths, and 2 manufacturers used in this study. Note that the differences among the distributions (means and SDs) are statistically insignificant, independent of the (healthy) subjects’ age or sex, indicating that the methodology is robust to instrumentation differences.

