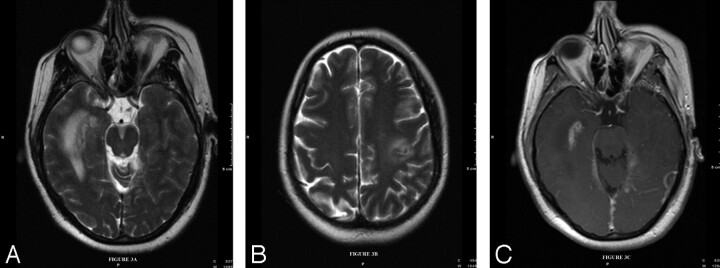
Fig 3.
Axial T2-weighted images of the brain (TR = 6000, TE = 125) show multiple areas of hyperintensity within the subcortical white matter parenchyma in the medial right temporal lobe (A) and posterior left frontal lobe (B). T1-weighted (TR = 635, TE = 17) gadolinium-enhanced sequences show nodular dural and pial enhancement (C).

