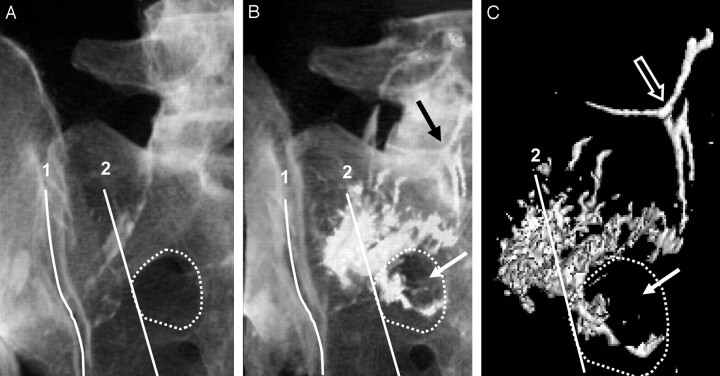
Fig 3.
3D reconstructed CT images (A–C) of a hemisacrum from a single cadaveric pelvis are shown in a left posterior oblique orientation. Anatomic landmarks used for injection overlie the sacrum and correspond to the following: first, a line superimposed on the medial edge of the sacroiliac joint,1 and second, a line connecting the lateral edge of the posterior foraminal openings.2 A dotted line demonstrates the outline of the most superior sacral foramen. Note that PMMA spreads beyond the foraminal landmark2 and is appreciated within the sacral foramen (white arrow) and intravascular space (black arrow, B). Additional reformatting of the CT images (C) reveals the isolation of PMMA attenuation from sacral bone and more clearly shows PMMA tracking beyond the posterior foraminal landmark2 into the sacral foramen (solid arrow) and intravascular space (open arrow).

