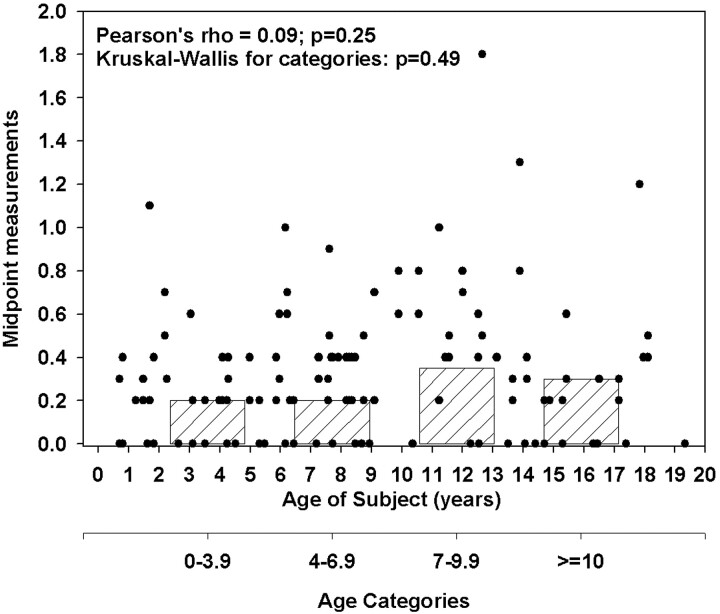
Fig 7.
Scatter and box plot of midpoint measurement compared with age of subject. The dots represent the scatter plot of midpoint measurements (mm) by age of subject in years. The bar graphs represent the bottom offset axis for the median midpoint measurements (mm) by the 4 age categories (0–3.9 years, 4–6.9 years, 7–9.9 years, and >10 years).

