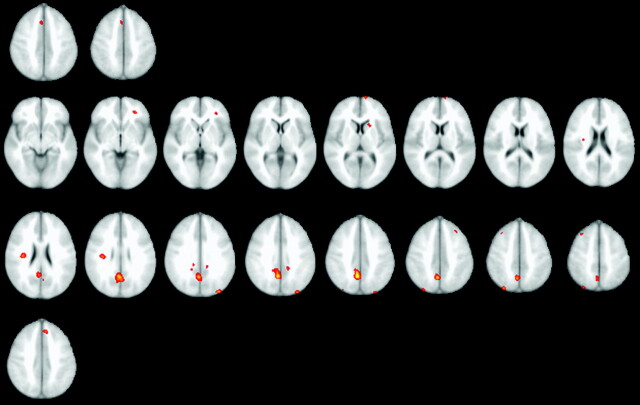
Fig 5.
A, Brain areas negatively associated with group average RT, shown in the top row, found to be the anterior cingulate cortex. Changing brain activation colors from red to yellow correspond with Z-values of 3.0–4.3, respectively. B, Both center rows reveal brain areas positively associated with group average RT. Regions involved were found to be the posterior cingulate cortex and left middle frontal gyrus. Changing brain activation colors from red to yellow correspond with Z-values of 3.0–4.3, respectively. C, The bottom row shows that the anterior cingulate cortex was also negatively associated with individual RT. Brain regions involved were calculated by using fixed-effects analysis (P < .001, uncorrected). Changing brain activation colors from red to yellow correspond with Z-values of 3.0–3.8 for the bottom row. The right side of the brain on the image corresponds with the left hemisphere, and vice versa.

