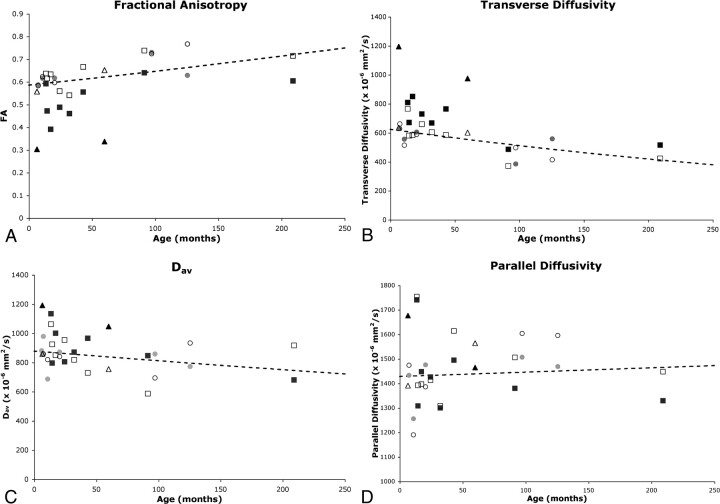
Fig 2.
Comparison of diffusion parameters in affected and unaffected tracts of the patients with normative curves. Fractional anisotropy (A), transverse diffusivity (B), Dav (C), and parallel diffusivity (D) are plotted against age for the patients with mild hemiparesis (circles), those with moderate hemiparesis (squares), and those with severe hemiparesis (triangles). Both affected (solid symbol) and unaffected (open symbol) pyramidal tract diffusion values are plotted for each patient. Values are compared with the normative curves (dashed curve) of the natural logarithm of the diffusion metric versus age (see Methods).

