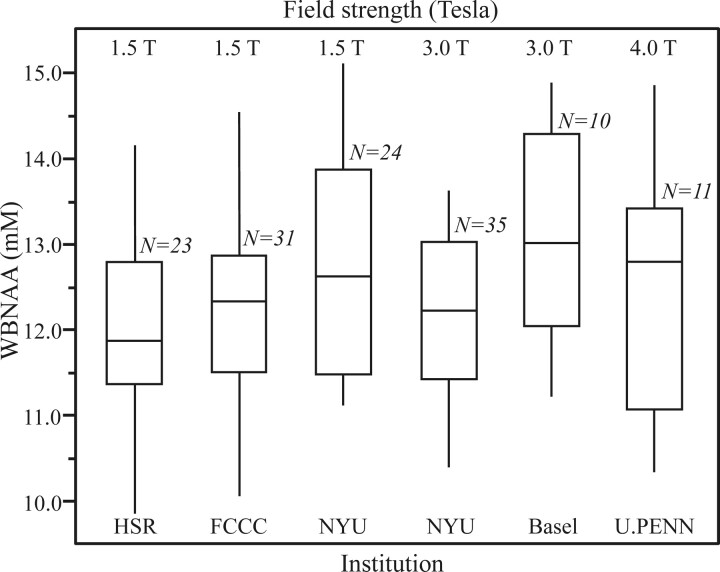
Fig 4.
Box plot showing the 25%, 50% (median), and 75% quartiles (box) and ±95% (whiskers) of the distributions of the subjects’ WBNAA concentrations in each of the 5 institutions, 6 scanners, 3 field strengths, and 2 manufacturers used in this study. Note that the differences among the distributions, 12.2 ± 1.2 mmol/L (means and SDs), for more than 120 healthy individuals are statistically insignificant, independent of these subjects’ ages or sex, indicating that the methodology is robust to instrumentation differences. HSR indicates Hospital San Rafael (Italy); FCCC, Fox Chase Cancer Center (USA); NYU, New York University (USA); Basel, Basel (Switzerland); U.PENN, University of Pennsylvania (USA).

