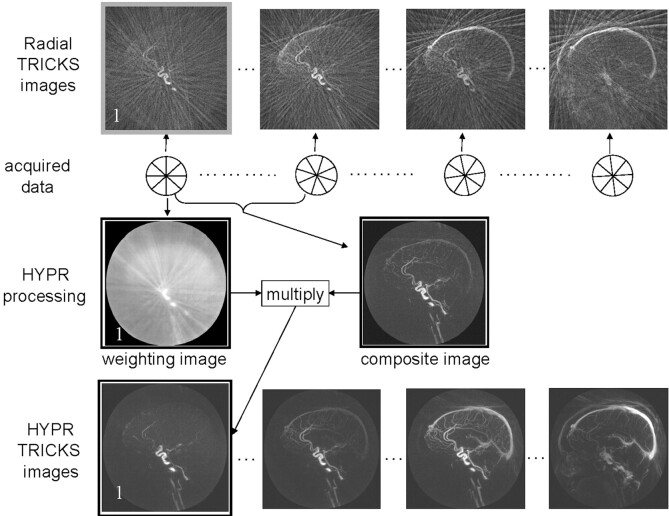
Fig 1.
Schematic diagram of the HYPR reconstruction algorithm. Data were acquired by using undersampled radial trajectories. Images in the top row were reconstructed by using filtered backprojection. Images in the bottom row were reconstructed by using the HYPR method. All processing was performed on the source images, and the resulting maximum-intensity-projection images are shown. The low attenuation of vessels (high sparsity) in the source images makes them amenable to HYPR processing. For the HYPR processing, note that the sagittal sinus that appears in the composite image is suppressed following multiplication by the weighting image for frame 1.

