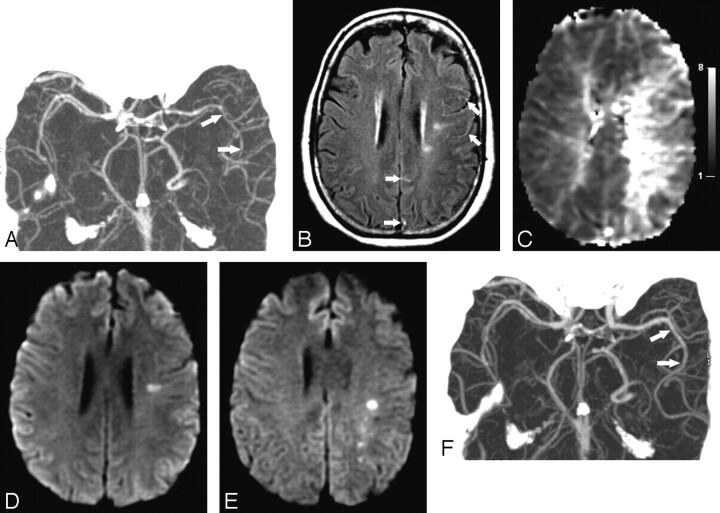
Fig 1.
Neuroimaging findings in a 54-year-old woman with RCVS after CEA. A, CTA on day 1 shows attenuation and segmental narrowing of the left ACAs and MCAs (arrows). These abnormalities were not present on a CTA performed before the endarterectomy. B, FLAIR image from the brain MR imaging on day 1 shows multiple punctate and curvilinear hyperintensities (arrows) overlying the left cerebral hemisphere, suggesting slow blood flow within abnormally dilated arteries. C, Mean-transit-time maps from the perfusion MR imaging on day 1 (gray scale in seconds) show hypoperfusion within the left internal watershed arterial territories and relative sparing of the superficial cortical regions. D, Diffusion-weighted brain MR imaging on day 1 shows a posterior left frontal-lobe infarction, which was present before the CEA, but no new lesion. E, Repeat diffusion-weighted brain MR imaging on day 3 shows new acute infarctions developing within the previously noted regions of subcortical hypoperfusion. F, Repeat CTA performed after 2 months shows complete resolution (arrows) of the arterial vasoconstriction.

