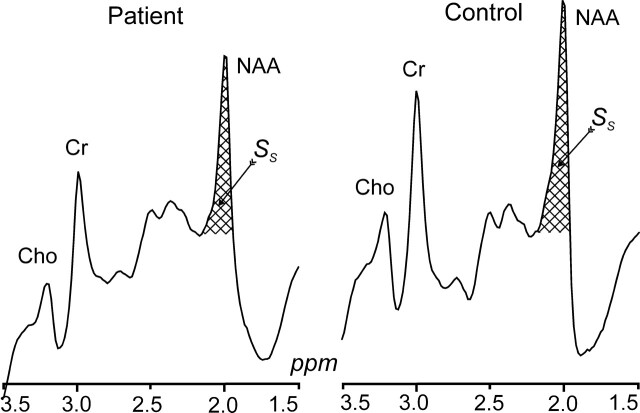
Fig 2.
Whole-head 1H spectra, left patient 9, right (matched) control subject 5 in Tables 1 and 2. The hatched regions indicate the peak-areas used to obtain QNAA of Eq 1. Note the excellent lipid suppression. Also note that localization relies on knowledge that NAA, unlike the other metabolites (eg, choline, creatine, etc), is exclusive to neuronal cells.

