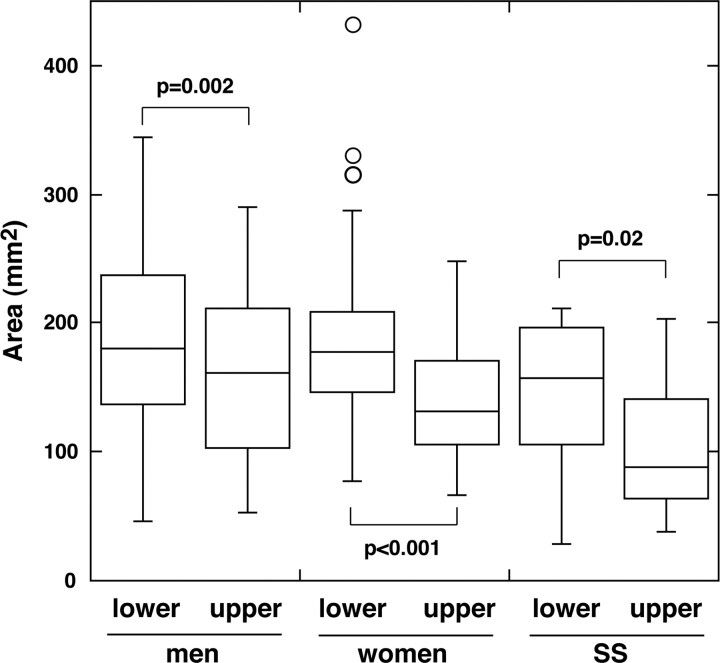
Fig 3.
Box plot graph shows areas of healthy upper and lower labial salivary glands in men and women and of upper and lower labial salivary glands in patients with Sjögren syndrome (SS). The horizontal line in each box is a median (50th percentile) of the measured values; the top and bottom of the boxes represent the 25th and 75th percentiles, respectively; and whiskers indicate the range from the largest to smallest observed data points within a 1.5-interquartile range presented by the box (P value, Wilcoxon signed rank test).

