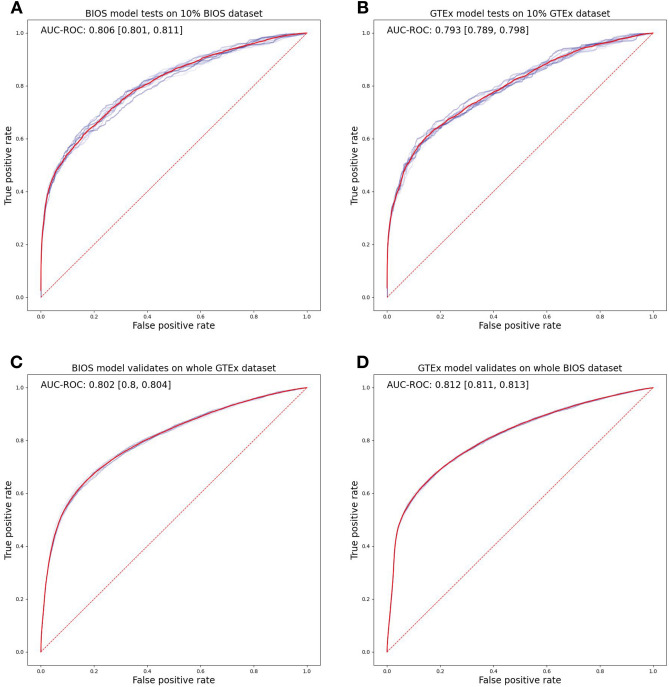
Figure 2.
ROC curves of ASE prediction models. ROC curves to measure the performance of ASE prediction models on test sets with tenfold application for standard deviation. (A) shows the BIOS-trained model applied to 10% ‘leave out’ BIOS test sets. (B) shows the GTEx-trained model applied to 10% ‘leave out’ GTEx test sets. (C) shows the BIOS-trained model applied to the full GTEx set. (D) shows the GTEx-trained model applied to the full BIOS set. Plot was produced by Matplotlib68 version 3.0.0 under Python69 version 3.5.1.

