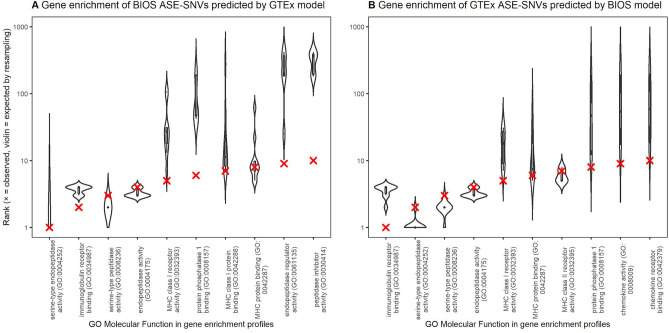
Figure 4.
Bias test of BIOS and GTEx models. (A) Each violin represents the distribution of expected GO Molecular Function term ranks based on 10 random resampling of BIOS ASE-SNVs using the same number of predicted ASE-SNVs. Each X indicates the observed rank of a GO Molecular Function term in the gene enrichment profile of BIOS ASE-SNVs correctly predicted by the GTEx model. For instance, the expected rank of endopeptidase activity (GO:0004175) lies around 3–4, and was observed at rank 4. (B) Each violin represents the distribution of expected GO Molecular Function term ranks based on 10 random resampling of GTEx ASE-SNVs using the same number of predicted ASE-SNVs. Each X indicates the observed rank of a GO Molecular Function term in the gene enrichment profile of GTEx ASE-SNVs correctly predicted by the BIOS model. For instance, the expected rank of serine-type peptidase activity (GO:0008236) lies around 2, and was observed at rank 3. Plot was produced by R70 version 3.3.0 using packages ggplot271 (v2.2.1), gridExtra (v2.3) and stringr (v1.3.1).

