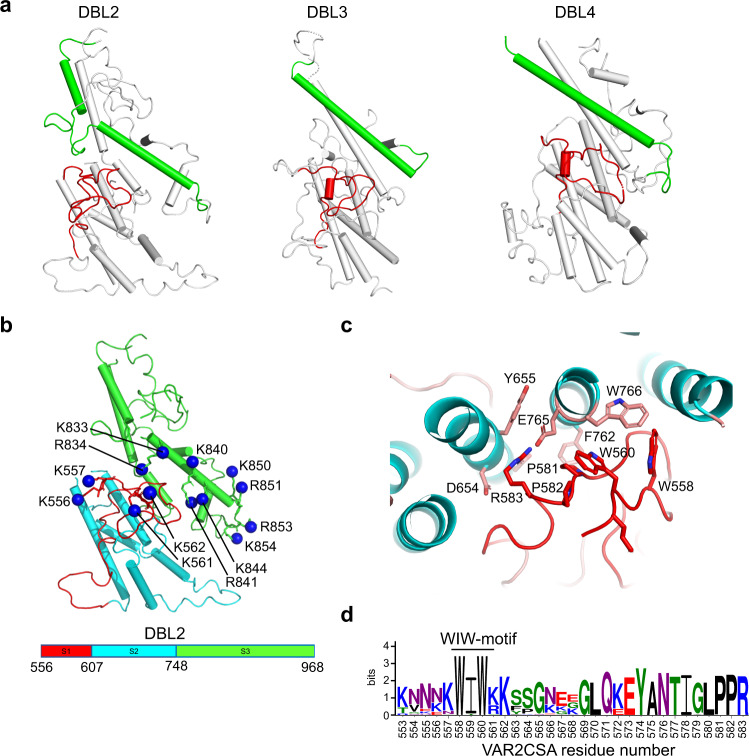
Fig. 2. Structural analysis of DBL2 and CS binding groove.
a Comparison of domains DBL2, DBL3 and DBL4. The red loop shows the “WIW-motif”-loop from each domain, the green α-helix shows HB1. In DBL2, an additional loop in HB1 introduces a kink in the α-helix. b DBL2 domain shown as cartoon, the red loop shows S1 (HB4 and “WIW-motif”-loop), blue α-helices show S2 (HB3-HB5) and green α-helices show S3 (HB2-HB1). S1-S3 residue boundaries and colors are shown in legend below. The distal nitrogen atom of Lys/Arg residues side chains in binding groove are shown as blue spheres and labeled according to residue number. c Structural details of the interaction between “WIW-motif” and HB2/HB3 in DBL2. Interacting side chains are shown as sticks and are labeled with residue numbers. d LOGO conservation analyses of “WIW-motif”-loop AA553-583 in var2csa variants. Residue number from VAR2CSA sequence shown below.

