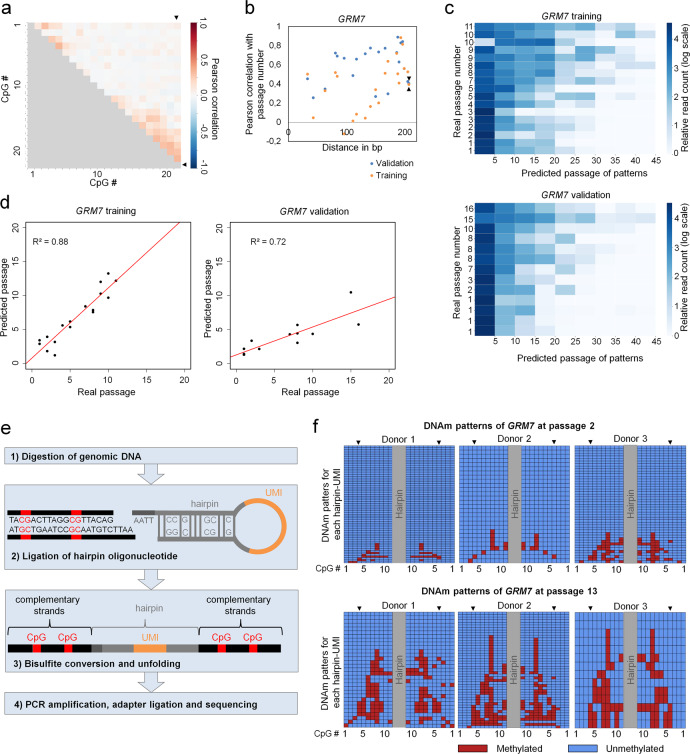
Fig. 4. DNA methylation of neighboring CpG sites in the amplicon of GRM7.
a Pearson correlation of DNAm levels at neighboring CpG sites of the BBA-Seq amplicon of GRM7. The CpG site included in the Epigenetic-Culture-Expansion-Signature is CpG #22, depicted by black arrow heads. b Pearson correlation with passage number of neighboring CpGs in GRM7. The CpG site included in the Epigenetic-Culture-Expansion-Signature is the CpG at 207 bp, depicted by black arrow heads. Correlations are depicted for a training set (the two RGB labeled donors depicted in Fig. 3a and Supplemental Fig. 3a) and a validation set of our previous study8. c Heatmaps of single read predictions for the amplicon of GRM7 show a high heterogeneity of predictions within each of the samples of the training and validation set. d The mean of the single read predictions correlated with real passage numbers. e Schematic presentation of DNAm analysis on complementary DNA strands using hairpin ligation and BBA-Seq (UMI = unique molecular identifier). f DNAm patterns of eleven neighboring CpGs in GRM7 are depicted on complementary strands (MSC of three different donors in early and late passages). The CpG site included in the Epigenetic-Culture-Expansion-Signature is CpG #4, depicted by black arrow heads on both strands. Each row represents patterns for an UMI in the hairpin (Supplemental Data 4).

