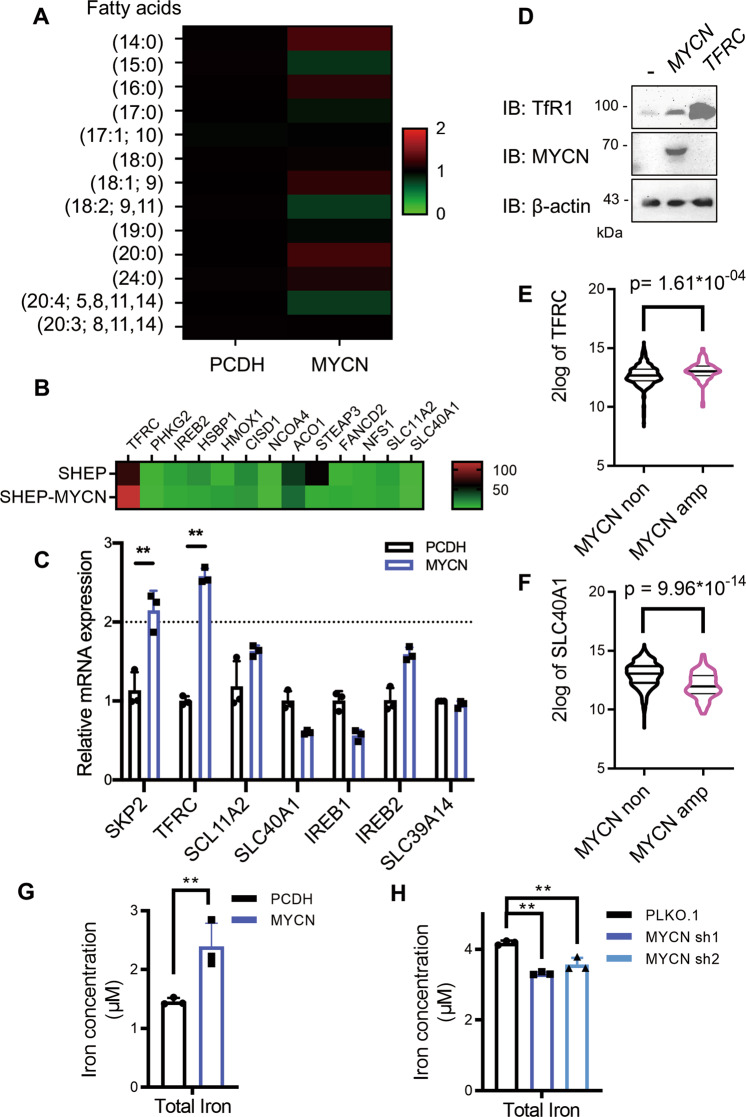
Fig. 3. MYCN increases the intracellular iron load.
A Heatmap showing changes in an array of fatty acids in SHEP cells with or without MYCN. Data are shown as relative changes in abundance compared to the PCDH vector. B Heatmap showing the expression profile of ferroptosis-associated metabolic genes. C Expression of MYCN induced iron metabolic genes analyzed by RT-qPCR, and SKP2 is positive control of MYCN targeted genes. D Western blot analysis of SHEP cells with or without MYCN expression using indicated antibodies. E, F TFRC and SLC40A1 expression in NB tumor tissues with or without MYCN amplification. Expression data were retrieved from GSE45547. Cellular iron load is detected with the colorimetric ferrozine-based assay in SHEP G and SK-N-BE2 H cells with or without MYCN, and values are normalized to protein concentration. Data are presented as mean ± SD of three replicates. Two-tailed unpaired t-tests were performed to calculate p values. **p < 0.01.

