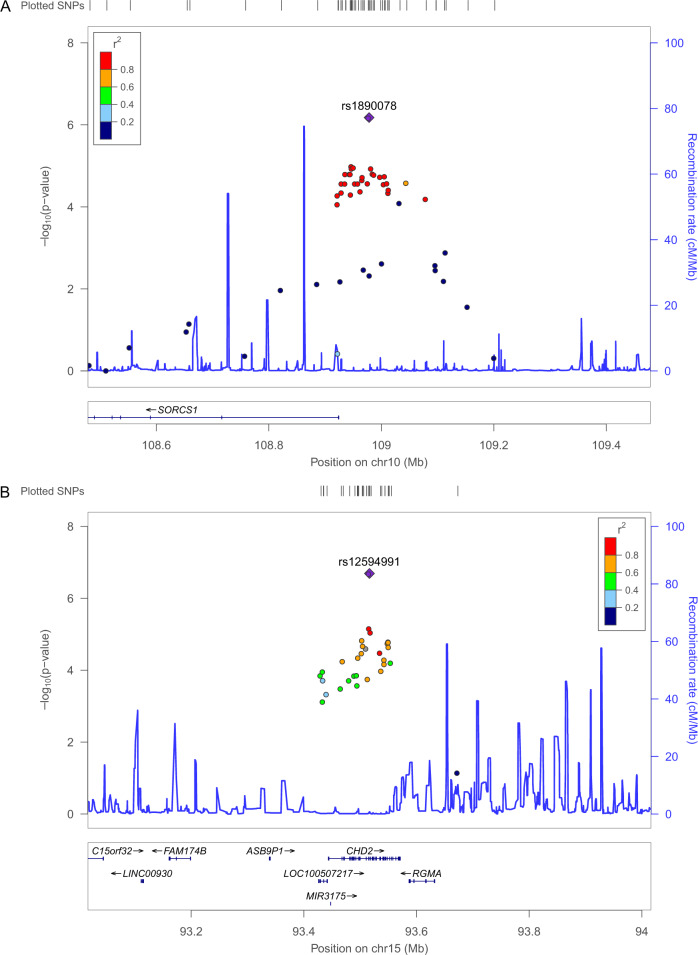
Fig. 3. Regional plot of novel candidate variants significantly associated within APOE ε4 carriers.
The figures show the regional association plot of known representative loci, (A) 10q25.1; SORCS1 and (B) 15q26.1; CHD2, in the cAD chip application set with a combined P value < 0.000001. The purple shaded diamond shape represents rs1890078 and rs12594991, which are the most significant SNPs in 10q25.1 (A) and 15q26.1 (B), respectively. The blue line indicates the recombination rate, while filled color represents the linkage disequilibrium score based on r2 values estimated from the 1000 genome Nov 2014 ASN data.

