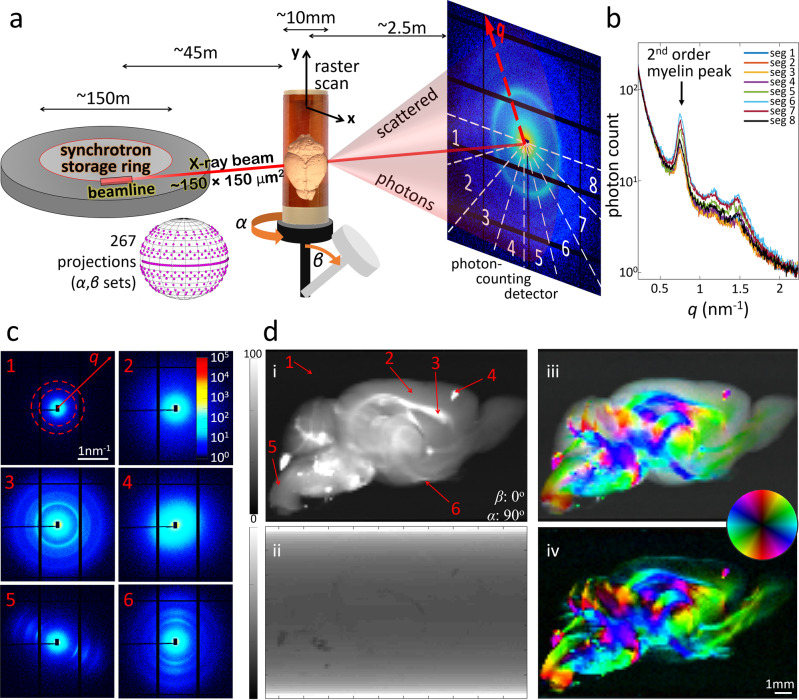
Fig. 1. SAXS-TT experiments on mouse brain.
a SAXS-TT setup, with typical setup values. Real setup images from 3 synchrotrons in Supplementary Fig. 1. b Scattering intensity from one scan point against reciprocal vector q, for detector azimuthal segments in a. c Scattering patterns from points in d (i). Color bar: photon-count. Patterns: 1—embedding medium; 2—gray matter; 3, 5, 6—white matter; 4—bone residue on brain surface. d 2D maps for the (α, β) = (90o, 0o) projection, based on the signal along the beampath for each point. (i): azimuthally averaged myelin-peak scattering intensity, (ii): X-ray transmission, (iii, iv): color-encoded 2D orientation with (iii) and without (iv) averaged scattering intensity in (i). Color bars (i): photon-count, (ii): arbitrary units. In (iii, iv), hue-saturation represent 2D orientation-degree of orientation respectively.

