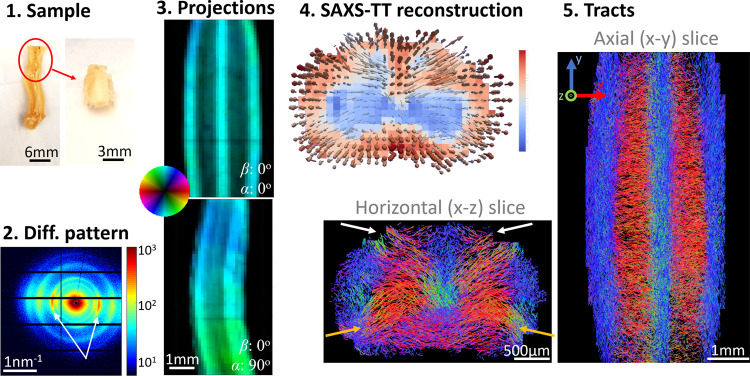
Fig. 3. SAXS-TT on mouse spinal cord.
1 The cervical part of the fixed spinal cord was scanned and 2 produced strong myelin peaks in the diffraction patterns (white arrows). 3 Each 2D scan resulted in a projection depicting SAXS myelin peak intensity and 2D orientation of the myelinated axons. 4 Tensor-tomographic reconstruction of all projections provided 3D fiber orientations per voxel, here visualized by a vector map for a virtual section. Vectors are colored based on myelin levels in the corresponding voxel. 5 A probabilistic tractography algorithm enabled generating neuronal tracts for the specimen, an axial and a horizontal section of which are shown. Arrows point to anterior (orange) and posterior (white) horns.

