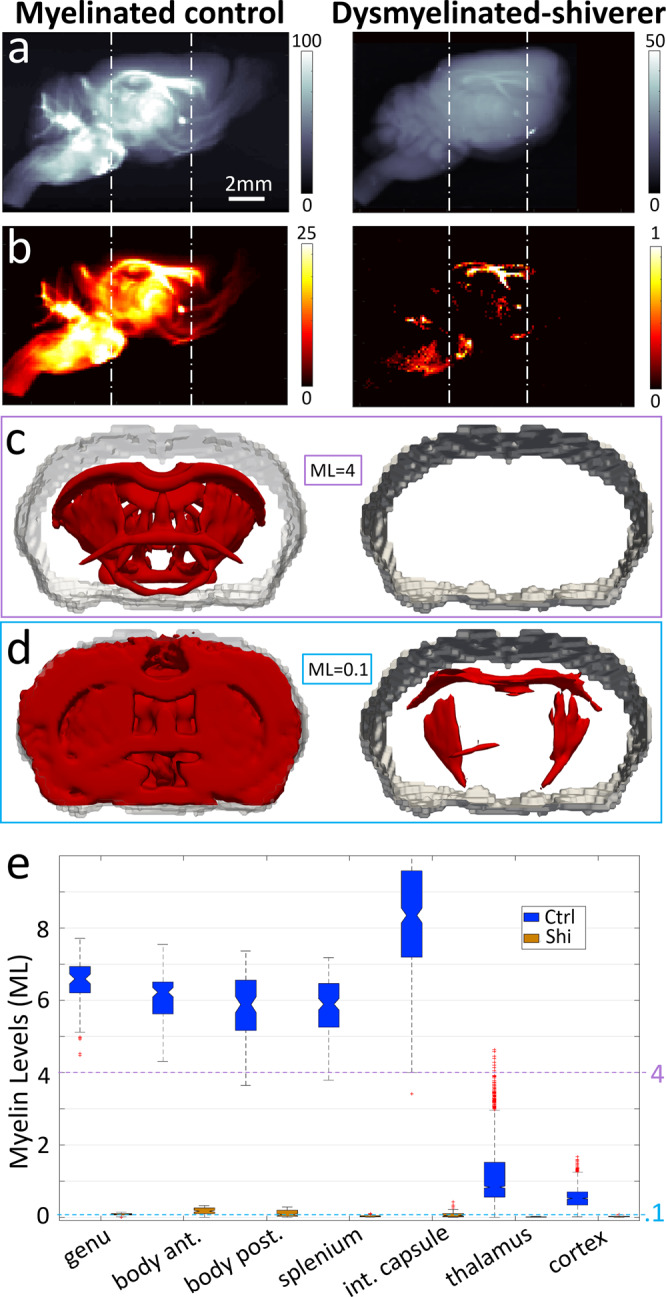
Fig. 7. Control vs. dysmyelinated (shiverer) mouse brain.

a Side projection of mean scattering intensity at myelin peak. b Same projection, with myelin-specific signal isolated. Color bars: photon-count. c, d 3D myelin maps at different myelin level (ML) thresholds for the region between dotted lines in a, b. ML units: scattered photons/voxel; ML = 4: highly myelinated areas in control mouse appear, no area in shiverer; ML = 0.1: white matter regions just appear in shiverer vs. almost entire brain for control. e Myelin levels for control (Ctrl-blue) and shiverer (Shi-orange) brains, for selected areas. ROI voxel numbers for control/shiverer: genu: 71/80, body anterior: 105/94, body posterior: 99/93, splenium: 136/63, internal capsule: 337/119. thalamus: 2740/210, cortex: 1018/403. White matter ROIs were eroded with a 3 × 3 × 3 box kernel to avoid partial volume effects. Box plots: notch → median, box → 25–75 percentiles, whiskers → ±2.7 standard deviations from mean, red crosses → outliers. Source data are provided as a Source Data file.
