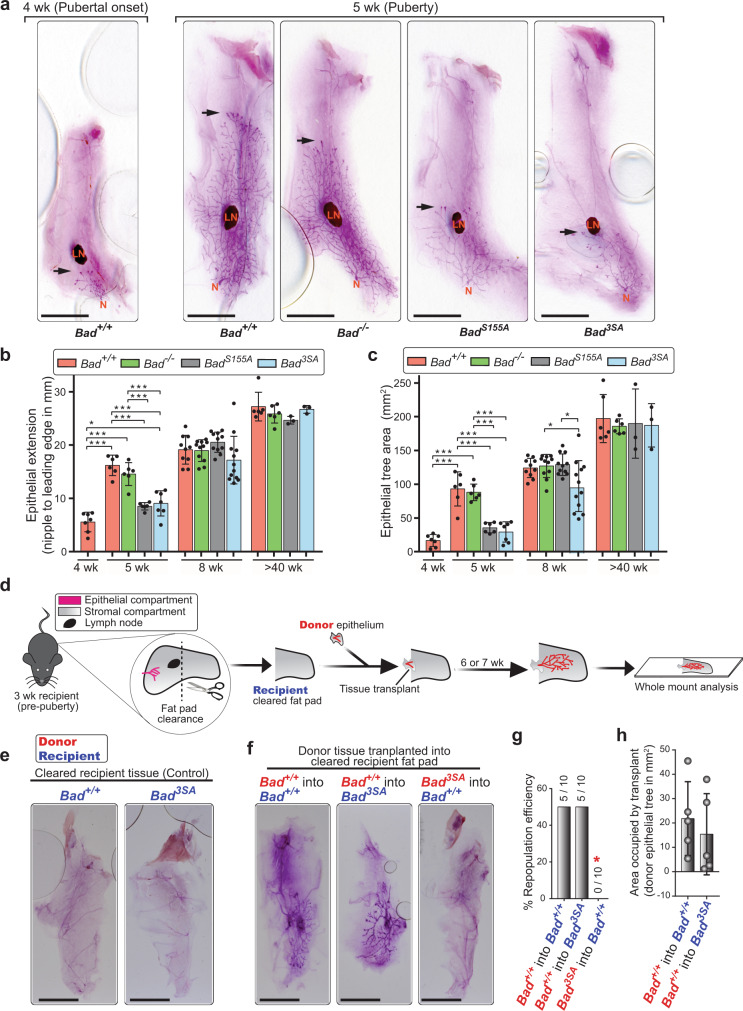
Fig. 2. Bad3SA shows defective mammary gland development in puberty that is derived from the epithelial compartment.
a Representative carmine-stained mammary gland whole mounts (WMs) showing pubertal morphogenesis of Bad mutants. Shown are the #4 mammary glands of 5wk mice of Bad+/+ (n = 6), Bad−/− (n = 6), BadS155A (n = 6), and Bad3SA (n = 7). For comparison, a control Bad+/+ gland at 4wk (left, n = 7) representing early pubertal onset is included. The epithelial tree (dark pink branched structure) is embedded within the mammary fat pad (surrounding light pink stroma). N, nipple; LN, lymph node. Arrows highlight front of migrating epithelial tree. Scale bars = 5 mm. b, c Quantitation of epithelial tree morphological features for Bad+/+, Bad−/− BadS155A, and Bad3SA at different developmental times (5wk, 8wk, >40wk). b) Quantitation of epithelial tree extension shows delay in BadS155A (gray) and Bad3SA (blue) at 5wk. c Quantitation of epithelial tree area shows decreased area in BadS155A (gray) at 5wk and Bad3SA (blue) at 5wk and 8wk. Data are mean ± SD. Number of animals: For pubertal onset (4wk), Bad+/+ n = 7. For puberty stage (5wk), towards end of puberty (8wk) and aged virgins (>40wk), Bad+/+ n = 6, 10, 6; Bad−/− n = 6, 11, 6; BadS155A n = 6, 11, 3; and Bad3SA n = 7, 12, 3, respectively. d Transplant assay schematic showing fat pad clearance in recipient mouse and subsequent donor tissue transplant. Donor tissue growth was assessed 6 or 7 weeks post transplant surgery. e Representative carmine-stained WMs of negative control “recipient” mice (n = 5 mice per genotype) that did not receive transplant shows the efficiency of fat pad clearance. Scale bars = 5 mm. f Representative carmine-stained WMs for experimental transplant series (n = 5 mice per transplant condition). Red text represents the donor tissue genotype and blue text represents the recipient genotype. Scale bars = 5 mm. g Percentage of cleared fat pads with successful transplant repopulation show failure of Bad3SA epithelium to repopulate fat pad (red asterisk). The ratio of successful repopulation per total transplants is shown on top of the bars. n = 10 for each group. Computed Chi-square (χ2) p-value = 0.0235. h Quantitation of area occupied by transplanted Bad+/+ epithelium in either Bad+/+ or Bad3SA fat pads show similar repopulation areas. Data are mean ± SD. n = 5 for each group. For all p-values, ***P < 0.001, **P < 0.01, *P < 0.05. Statistical test details and exact p-values are provided in Supplementary Data 4. Source data are provided in the Source data file.

