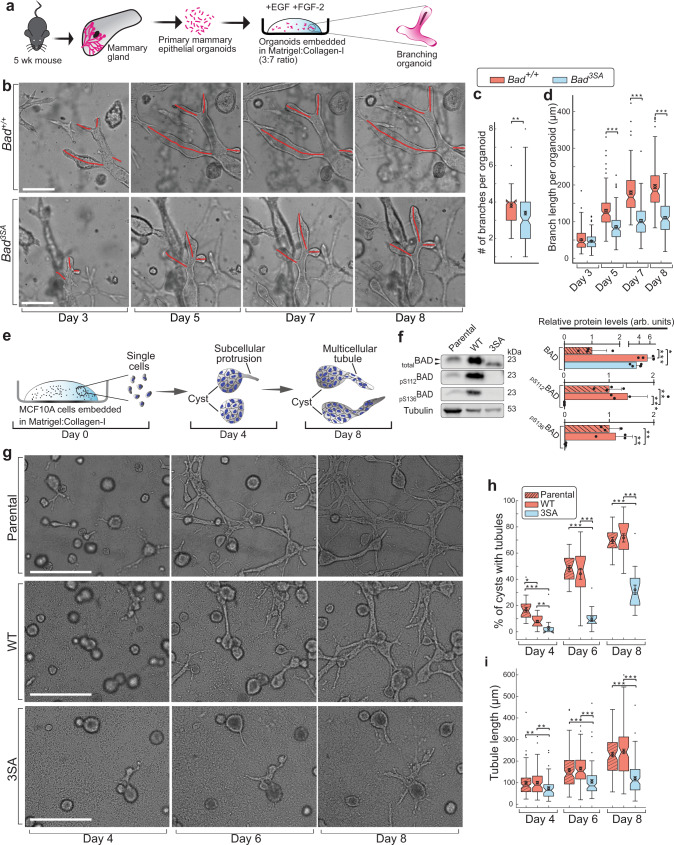
Fig. 3. 3D tissue organoid branching and MCF10A tubulogenesis assays show non-phosphorylatable BAD imparts defects.
a Schematic for 3D mouse organoid branching assay. EGF, epidermal growth factor; FGF-2, basic fibroblast growth factor. b Representative bright-field time-lapse images for Bad+/+ (upper) and Bad3SA (lower) organoid branching assays from three independent experiments, 2 replicates per experiment. Bad+/+ n = 150 organoids, Bad3SA n = 185 organoids. Red lines highlight individual branches used for quantitative measurements in (c, d). Scale bars = 200 µm. c Quantitation of number of branches per organoid. Data are represented as Tukey boxplots between Bad+/+ (orange) and Bad3SA (blue) organoids. d Quantitation of mean branch length per organoid. Data are represented as Tukey boxplots and show decreased branch length in Bad3SA (blue) organoids. Three independent experiments, 2 replicates per experiment. Bad+/+ n = 150 organoids, Bad3SA n = 185 organoids. e Schematic for 3D MCF10A tubulogenesis assay. f Left: western blots showing total BAD, pS112BAD, and pS136BAD in normal MCF10A (Parental) and WT and 3SA cells. Lysates were prepared from 3D tubulogenesis assays (day 7). Black arrowheads highlight gel shift indicative of BAD phosphorylation. Right: Quantitation of western blots. Data are mean ± SD of four independent experiments. g Representative bright-field time-lapse images for 3D MCF10A tubulogenesis assays of Parental (upper), WT (middle), and 3SA (lower) from three independent experiments. Fields of views for Parental n = 20, WT n = 21, 3SA n = 20. Scale bars = 500 µm. h Percentage of cysts with branches (i.e., undergoing tubulogenesis). Tukey boxplots show decreased proportion of branching cysts in 3SA (blue). Fields of views analyzed, Parental n = 20, WT n = 21, 3SA n = 20. i Quantitation of mean tubule length. Tukey boxplots show decreased tubule length in 3SA (blue). Three independent experiments, 2 replicates per experiment. Number of tubules analyzed, Parental n = 90, WT n = 103, 3SA n = 104. For Tukey boxplots, constriction indicates median, notch indicates 95% confidence interval, box edges are 25th and 75th percentiles, whiskers show extreme data points, ‘outliers’ plotted as black dots, overlaid circle, and error bars are the mean ± SEM. For all p-values, ***P < 0.001, **P < 0.01, *P < 0.05. Statistical test details and exact p-values are provided in Supplementary Data 4. Source data are provided in the Source data file.

