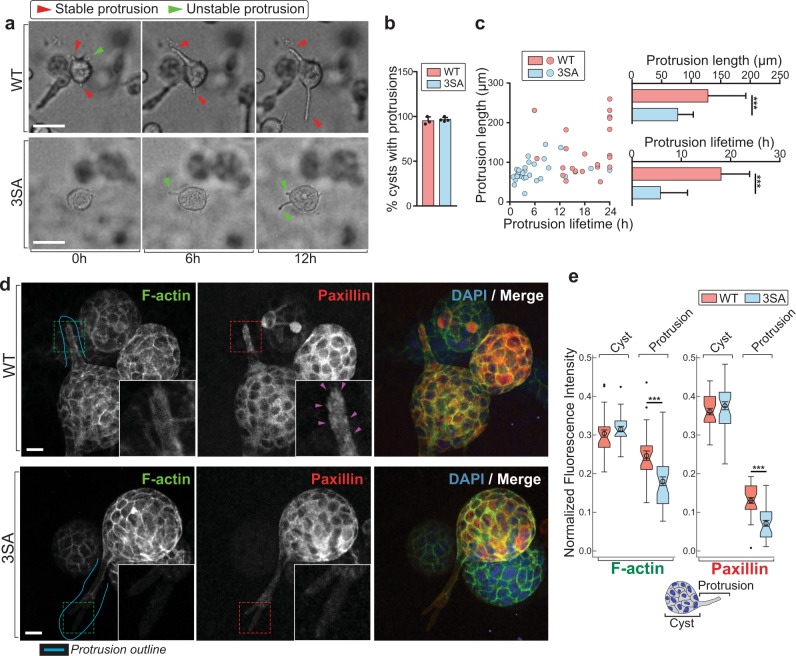
Fig. 4. 3D MCF10A cysts from 3SA have unstable protrusions.
a Representative bright-field time-lapse images of WT (upper) and 3SA (lower) MCF10 cysts in early 3D tubulogenesis assays, from three independent experiments. WT n = 23, 3SA n = 29 cysts (for complete time-lapse images, see Supplementary Movie 1). Individual subcellular protrusions either lengthen over time (red arrowheads) or are unstable and retract (green arrowheads). Scale bars = 100 µm. b Percentage of cell cysts that produced nascent protrusions (% cysts with protrusions) was not different between WT and 3SA. 3 independent experiments. c The length and lifetime of individual protrusions are shown as a scatter plot comparing WT (orange dots) and 3SA (blue dots). Quantitation shows decreased protrusion length (upper) and decreased protrusion lifetime (lower) in 3SA (blue). WT n = 23, 3SA n = 29, from three independent experiments. d Representative immunofluorescence images of cysts from WT (upper) and 3SA (lower) early tubulogenesis assays (day 4) stained with phalloidin (F-actin, green), anti-paxillin (focal adhesion marker, red) and DAPI (blue). DAPI highlights the nuclei in the multicellular cysts, and absence or presence of nuclei in the protrusions. The teal line is placed to outline subcellular protrusions subject to subsequent quantification analyses. Insets represent magnified areas indicated by dashed line boxes. Magenta arrowheads in the paxillin channel point to focal adhesion plaques. Scale bars = 20 µm. WT n = 30, 3SA n = 33, from three independent experiments. e Tukey boxplots show quantitation for normalized F-actin (left) or paxillin (right) fluorescence intensity in either the cells within the cyst (Cyst) or subcellular protrusions (Protrusion). Below is a schematic of the multicellular cyst (Cyst) with a subcellular protrusion (Protrusion). WT and 3SA show similar F-actin and paxillin staining in the cells within the cyst (Cyst). 3SA (blue) shows decreased F-actin (left) and paxillin (right) staining in the protrusion (Protrusion). WT n = 30, 3SA n = 33, from three independent experiments. For Tukey boxplots, constriction indicates median, notch indicates 95% confidence interval, box edges are 25th and 75th percentiles, whiskers show extreme data points, “outliers” plotted as black dots, overlaid circle, and error bars are the mean ± SEM. For all p-values, ***P < 0.001, **P < 0.01, *P < 0.05. Statistical test details and exact p-values are provided in Supplementary Data 4. Source data are provided in the Source data file.

