
Fig. 1. Baseline NM-MRI CNR correlates with baseline gait speed.
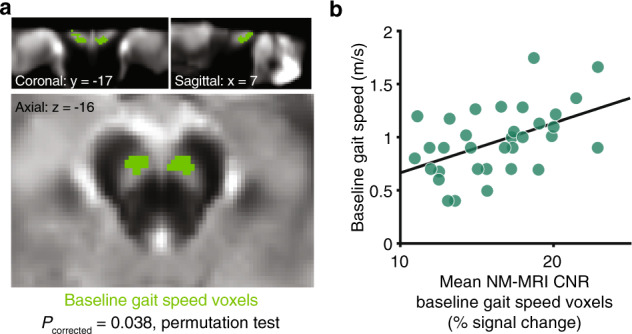
a Map of SN-VTA voxels where NM-MRI CNR positively correlated (thresholded at P < 0.05, voxel level) with a single-task measure of gait speed (green voxels) overlaid on the average NM-MRI CNR image from all subjects. b Scatterplot showing the average NM-MRI CNR extracted from the significant voxels in a plotted against gait speed for visualization purposes. These plotted data show a Pearson correlation coefficient of 0.49, although this effect-size estimate is likely inflated given the selection of significant voxels for this effect.