
Fig. 3. NM-MRI CNR significantly increases after 3 weeks of L-DOPA treatment in an exploratory analysis.
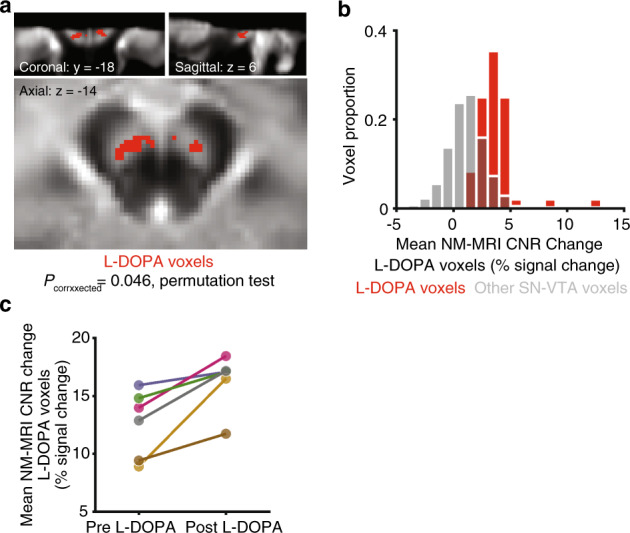
a Map of SN-VTA voxels where NM-MRI CNR was significantly increased after 3 weeks of L-DOPA (thresholded at P < 0.05, voxel level; red voxels) overlaid on the average NM-MRI CNR image from all subjects. b Histogram showing the average change across subjects in NM-MRI CNR after treatment including all SN-VTA voxels, which is generally shifted to the right of zero (denoting increased NM-MRI CNR). For visualization purposes, heights are proportional to either the number of L-DOPA voxels (N = 200; red bars corresponding to voxels in a or the number of Other SN-VTA Voxels (i.e., non-significant voxels; N = 1607); e.g., a bar with voxel proportion of 0.2 for L-DOPA voxels corresponds to 40 voxels while a bar with voxel proportion of 0.2 for Other SN-VTA Voxels corresponds to 321 voxels. c Ladder plot showing the average NM-MRI CNR extracted from the significant (red) voxels in a at baseline (Pre L-DOPA) and after 3 weeks of L-DOPA treatment (Post L-DOPA) for the 6 subjects (each shown in a different color to emphasize consistent increases across each subject).