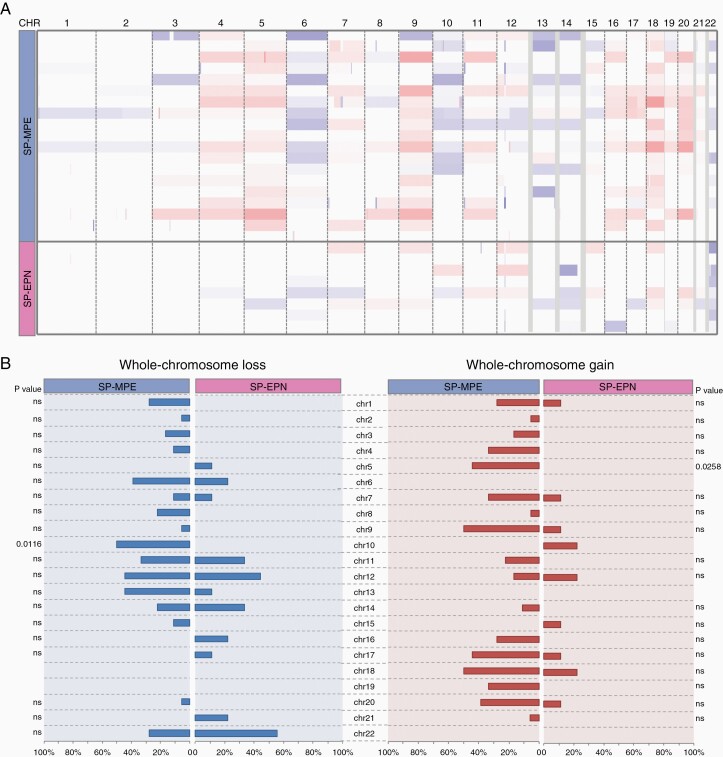
Figure 2.
Copy number variations across 2 molecular subgroups of pediatric spinal ependymal tumors. (A) Genome-wide view of copy number alterations in 27 pediatric spinal ependymomas estimated from DNA methylation arrays subdivided by 2 subgroups: SP-MPE and SP-EPN. The heatmap displays gains (red) and losses (blue) of each chromosome (column) across each sample (row) subdivided by SP-MPE and SP-EPN. (B) Summary of chromosomal imbalances showing distinct alterations within 2 molecular subgroups of ependymal tumors. Copy number plots were generated based on DNA methylation, color code for losses (blue) and gains (red) of chromosomal profiles. Results were plotted as frequencies at which these aberrations occurred within each molecular subgroup; significance is illustrated by P values, which indicate distinct distributions of alterations across the molecular subgroups (chi-square test).

