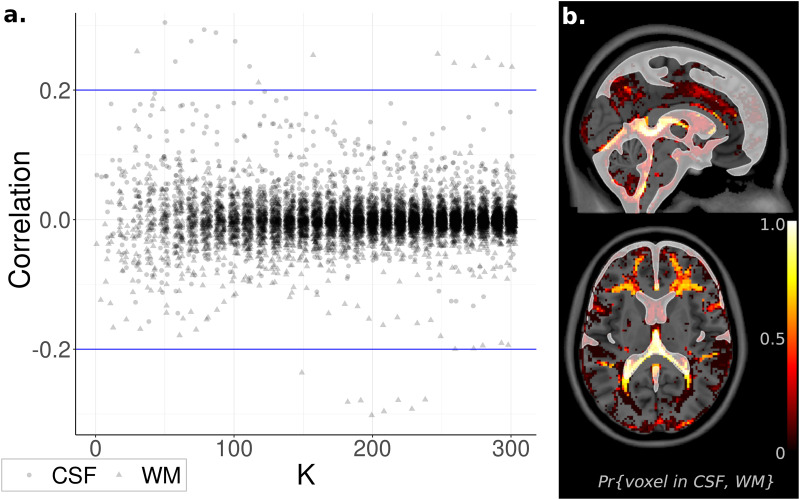
FIGURE 4.
Relationship to Noise Sources. (a) Component spatial maps correlated with white matter (WM) and cerebrospinal fluid (CSF) tissue probability maps and displayed with independent component analysis (ICA) model order K. Almost all correlations were near zero and unrelated to K. (b). Voxel Inclusion Probability Volumes (see Equation 3) for spatial maps with either correlation coefficient | rWM| or | rCSF| greater than 0.2. Spatial maps exceeding this cutoff were predominantly located in WM or CSF, minimally overlapping with gray matter.

