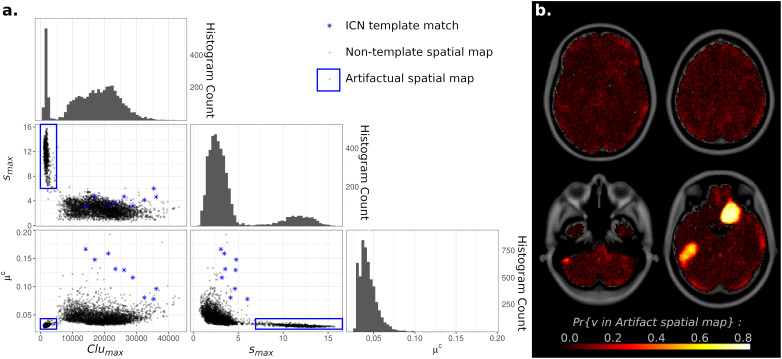
FIGURE 5.
(A) Histograms and Scatterplots of Maximum Intensity (smax), Largest Cluster Size (Clumax), and Average independent component analysis (ICA) Component (IC) Weight Outside of the Largest Cluster (μc) for all components. Histograms of all three measures showed bimodal distributions. Scatterplots demonstrated that components cluster into two disjoint clusters. Components matching known Intrinsic Connectivity Networks [ICNs (Yeo et al., 2011)] were all located within one cluster (blue stars), while components with overfitting “spike and bump” characteristics (high smax, small Clumax, and μc near zero) were located in the other scatterplot cluster (blue circle). (B) Voxel Inclusion Probability Volume (see Equation 3) showing the spatial distribution of artifactual spatial maps (blue square on left). Components resulting from artifactual overfitting were largely spread diffusely throughout all tissue types within the brain, consistent with a non-neuronal origin. Two prominent supratentorial spatial clusters were observed in the right olfactory and left inferior temporal cortices.

