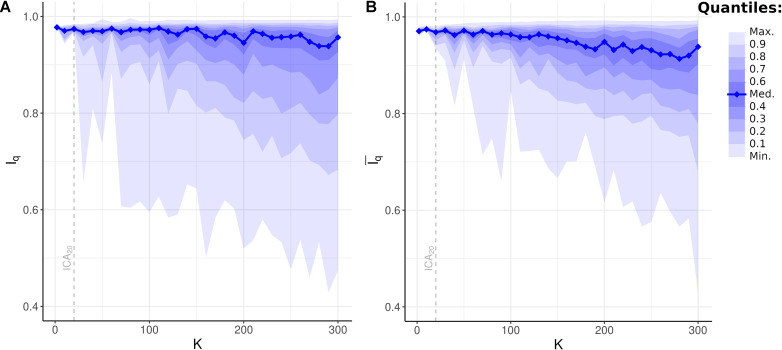
FIGURE 6.
Bootstrap Stability Indices Iq and independent component analysis (ICA) Model Order K. (A) Unweighted bootstrap stability index Iq, plotted as sample quantiles in increments of 10 (e.g., bottom lightest shade encompasses minimum to top 10th quantile of Iq at given model order), with the solid blue line showing median Iq. Upper quantiles remained highly stable even at high K, while lower quantiles gradually decreased. Dashed line: quantiles at K = 20 (i.e., ICA20). (B) Weighted average bootstrap stability index plotted as sample quantiles and median. Compared to unweighted Iq, weighted average demonstrated fewer outliers in the lowest quantiles resulting from network subdividing. Dashed line: quantiles at ICA20.

