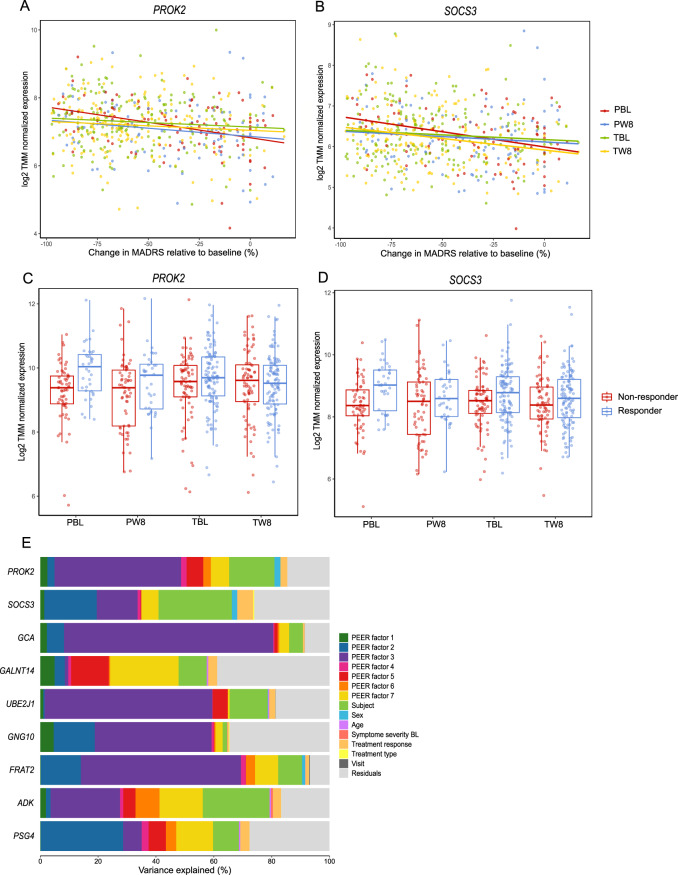
Fig. 1. Examination of genes correlated to treatment response.
Plots of log2-transformed TMM-normalized gene expression as a function of percentage improvement in MADRAS total score at week 8 from baseline for PROK2 (A) and SOCS3 (B). Percentage improvement is plotted to account for the MADRS score at baseline, since change in MADRS score depends on the MADRS score at baseline. Boxplots of log2-transformed TMM-normalized gene expression difference between responders and non-responders for each timepoint (baseline and week 8) and each treatment type (placebo and vortioxetine) for PROK2 (C) and SOCS3 (D). PBL = samples from placebo-treated patients at baseline; PW8 = samples from placebo-treated patients at week 8; TBL = samples from vortioxetine-treated patients at baseline; TW8 = samples from vortioxetine-treated patients at week 8. Response is defined as >50% decrease in the MADRS total score from baseline. E Bar plot of variance partitioned on the covariates in the experimental design for the nine genes, with an FDR < 0.05, related to treatment response.

