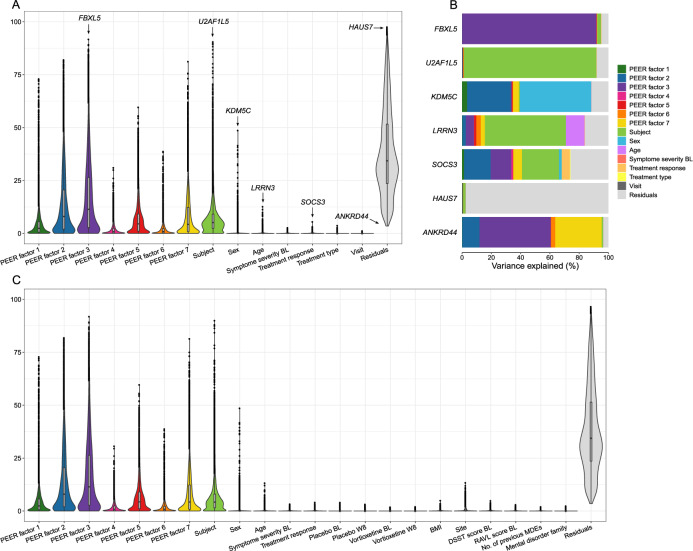
Fig. 2. Examination of the distribution of variance across all genes.
A Violin plot of the distribution of variance across all genes for the covariates in the experimental design. Inside the violin plots are boxplots. B Bar plot of variance partitioned on the covariates in the experimental design for the genes highlighted in plot A. The variance of the covariates for each gene sum to 1. C Violin plot of the distribution of variance across all genes for the covariates in the experimental design and explorative variables.

