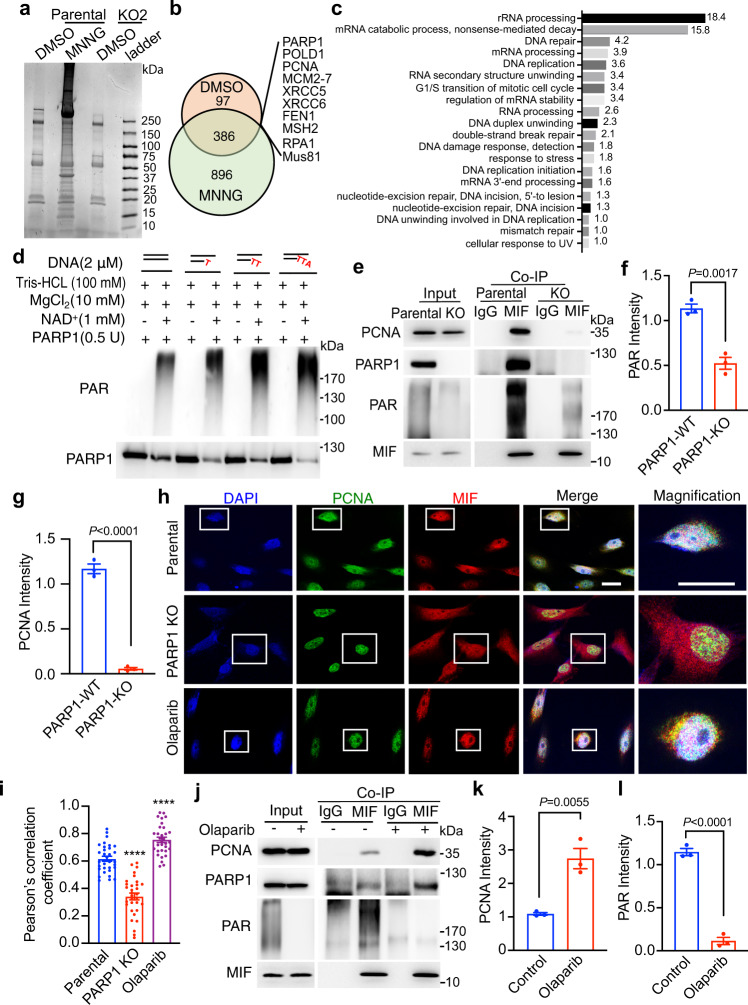
Fig. 5. PARP1 is required for the recruitment of MIF to DNA replication sites.
a Immunoprecipitation of endogenous MIF in parental and MIF KO HeLa cells under physiological conditions (DMSO) as well as 4 h after DNA damage (MNNG, 50 μM, 15 min). b Mass spectrometry analysis of MIF-interacting proteins in HeLa cells under physiological conditions (DMSO) as well as 4 h after DNA damage. c Functional annotation of overlapped MIF-interacting proteins under both physiological and DNA damage conditions using David Bioinformatics Resources 6.8. Values indicate the % of proteins detected in the database. Pathways with P < 0.05 were listed. d In vitro PARylation assay by incubating PARP1 with dsDNA containing 0–3 mismatched nucleotides at the 3′ end in the presence of 1 mM NAD+ and 10 mM MgCl2. Representative blots from three independent experiments are shown. e–g Co-IP of MIF and PCNA in parental and PARP1 KO MDA-MB-231 cells. Relative PAR and PCNA intensities were quantified and shown in f and g, respectively (mean ± SEM, n = 3 biologically independent experiments). Statistical significance was determined by two-tailed Student’s t test. h, i Immunostaining of MIF and PCNA in parental, PARP1 KO and Olaparib-treated (5 μM, 2 h) MDA-MB-231 cells 2 h following double thymidine synchronization. White indicates colocalization. Representative images from three independent experiments are shown in h. Scale bar, 20 μm. The Pearson’s correlation coefficient of MIF-PCNA colocalization was quantified and shown in i (mean ± SEM, n = 32 cells per group over three independent experiments). Cells with Pearson’s correlation coefficient (r) >0.5 is considered as the positive correlation of MIF-PCNA colocalization, r > 0.7 is considered as a strong correlation and r < 0.4 is considered as a weak or no correlation. ****P < 0.0001 compared to parental cells, by one-way ANOVA Dunnett’s multiple comparisons test. j Co-IP of MIF, PCNA, PAR, and PARP1 in MDA-MB-231 cells treated with or without Olaparib (5 μM, 2 h) following double thymidine synchronization. k, l Relative intensities of PCNA and PAR were quantified and shown in k and l, respectively (mean ± SEM, n = 3 biologically independent experiments). Statistical significance was determined by two-tailed Student’s t test.

