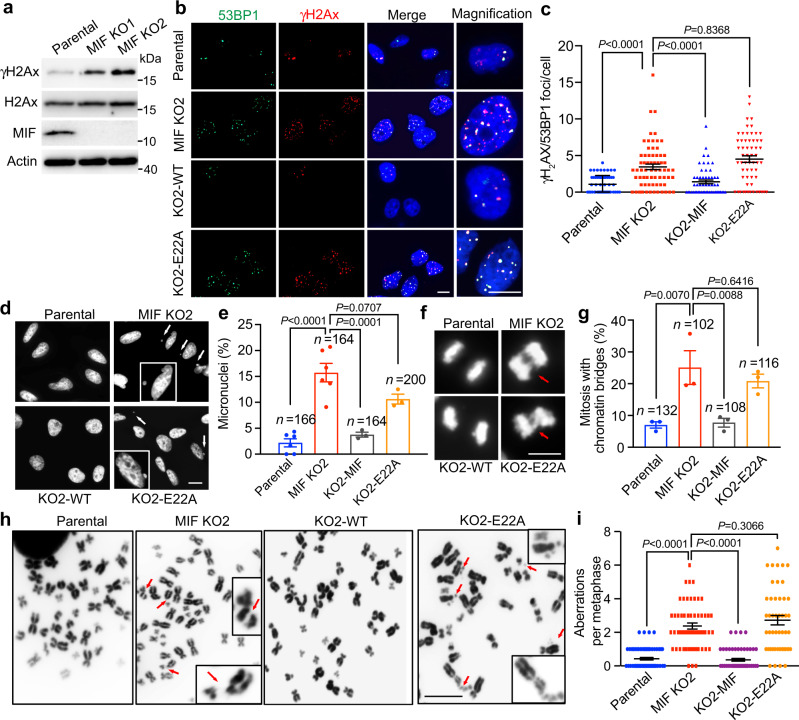
Fig. 6. Loss of MIF and its nuclease activity caused genomic instability.
a The basal levels of γH2AX protein in parental and MIF KO MDA-MB-231 cells. Representative blots from three independent experiments are shown. b, c Representative images of γH2AX and 53BP1 foci in parental, MIF-KO2, KO2 + MIF-WT and KO2 + MIF-E22A MDA-MB-231 cells (b). Data were quantified and shown in c (mean ± SEM). Scale bar, 20 μm. n = 58 cells (parental), n = 67 cells (MIF-KO2), n = 57 cells (KO2-MIF), and n = 59 cells (KO2-E22A) from three independent experiments were analyzed. Statistical significance was determined by one-way ANOVA Dunnett’s multiple comparisons test. d, e Representative images of micronuclei indicated by DAPI staining in parental, MIF-KO2, KO2 + MIF-WT, and KO2 + MIF-E22A MDA-MB-231 cells (d). Data were quantified and shown in e (mean ± SEM). Statistical significance was determined by one-way ANOVA Dunnett’s multiple comparisons test. Scale bar, 20 μm. f, g Representative images of chromosome bridges indicated by DAPI staining in parental, MIF-KO2, KO2 + MIF-WT and KO2 + MIF-E22A MDA-MB-231 cells (f). Data were quantified and shown in g (mean ± SEM). Statistical significance was determined by one-way ANOVA Dunnett’s multiple comparisons test. Scale bar, 10 μm. h, i Representative images of metaphase spread assay in parental, MIF-KO2, KO2 + MIF-WT, and KO2 + MIF-E22A MDA-MB-231 cells treated with colchicine for 2 h (h). Data were quantified and shown in i (mean ± SEM). n = 73 cells (parental); n = 56 cells (MIF-KO2); n = 58 cells (KO2 + MIF-WT) and n = 47 cells (KO2 + MIF-E22A) were analyzed from three independent experiments. Statistical significance was determined by one-way ANOVA Dunnett’s multiple comparisons test. Scale bar, 10 μm.

