Figure 1.
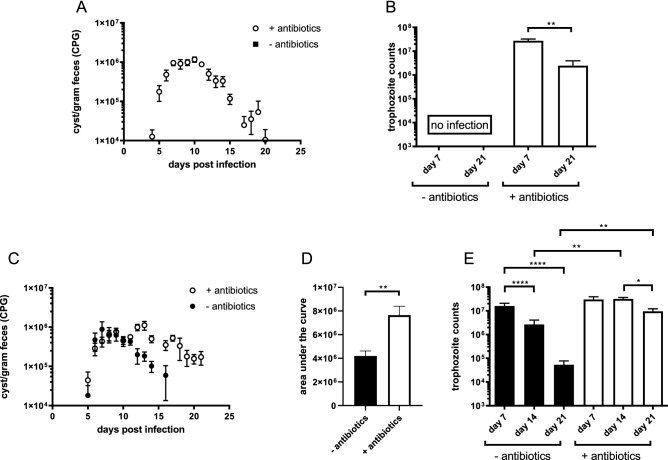
Dynamics of Giardia infections in mice following antibiotic treatment. (A) G. duodenalis cysts present in the feces of antibiotic-treated and untreated mice were monitored daily until day 21 p.i. Mean numbers of cysts per gram faeces obtained from 5 mice at every time point are depicted, with SEM as error bars. (B) G. duodenalis trophozoite numbers in the small intestine of antibiotic-treated C57Bl/6 mice at indicated time points. No trophozoites were detected in the untreated mice. (C) G. muris cysts present in the faeces of antibiotic-treated and untreated mice were monitored from day 4 p.i. until day 21 p.i. Mean numbers of cysts per gram faeces obtained from 5 mice at every time point are depicted, with SEM as error bars. (D) Area under the curve analysis of cyst counts between antibiotic treated and untreated C57Bl/6 mice infected with G. muris (E) G. muris trophozoite numbers in the small intestine of antibiotic-treated and untreated C57Bl/6 mice at indicated time points. (*p ≤ 0.05, **p ≤ 0.01, ***p ≤ 0.001, ****p ≤ 0.0001).

