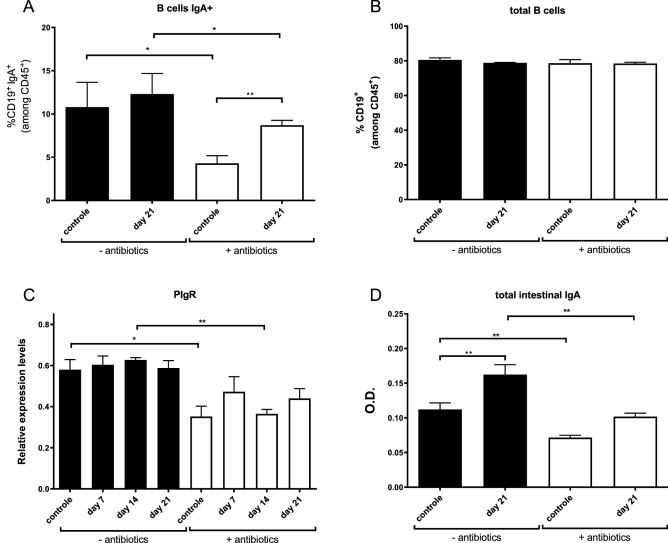
Figure 5.
Effect of antibiotic treatment and G. muris infection on the intestinal production and secretion of IgA. (A) Relative percentage of IgA producing B-cells within the CD45+ cell population isolated from the Peyer’s patch tissue. (B) Relative percentage of total B-cells within the CD45+ cell population isolated from the Peyer’s patch tissue. (C) Relative mRNA expression levels of PIgR measured by qPCR at indicated time points. (D) Total intestinal IgA levels. Results are shown as the mean from 5 mice with SEM as error bars. (*p ≤ 0.05, **p ≤ 0.01).

