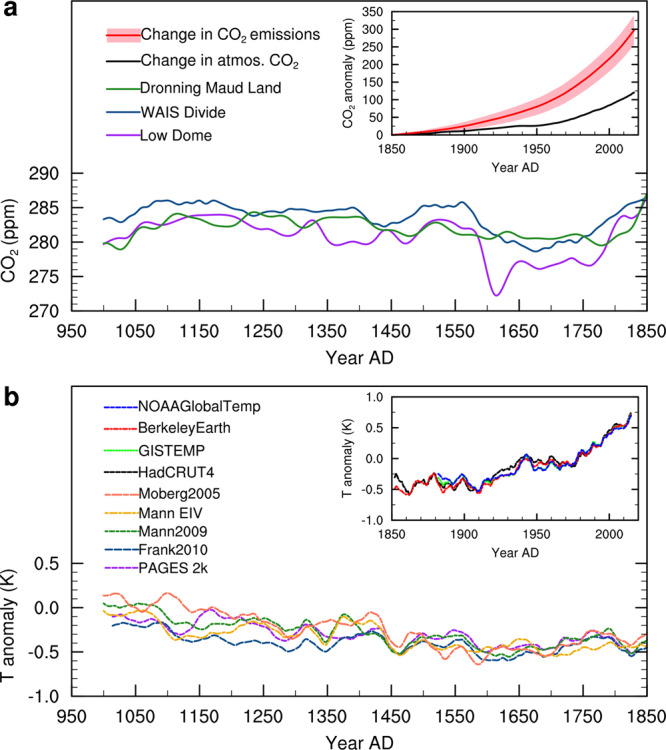
Fig. 1. Variability in atmospheric CO2 concentration and temperature over the past millennium.

a Variations in atmospheric CO2 concentrations over 1000–1850 from three Antarctic ice-core records at Law Dome, WAIS Divide, and Dronning Maud Land. The subplot in a shows changes in atmospheric CO2 concentrations and cumulative anthropogenic CO2 emissions over 1850–2017 with respect to values in 1850. The cumulative anthropogenic CO2 emissions with an uncertainty of ±1σ confidence interval (red-shaded) include CO2 release from both fossil fuel combustion and land-use change (unit was converted to ppm from GtC). b Variations in northern hemispheric-mean temperature anomalies from five reconstructions (PAGES2k, Frank2010, Mann2009, MannEIV, and Moberg2005). The subplot in b shows global-mean temperature anomalies calculated from land surface air temperature and sea surface temperature with respect to the average of 1961–1990 from datasets of HadCRUT4 and Berkeley Earth for 1850–2017, and GISTEMP and NOAA GlobalTemp for 1880–2017. The reconstructions of 1000–1850 in (a) and (b) were smoothed with 30-year splines. Temperature anomalies in 1850 (1880)–2017 in (b) were smoothed with 5-year splines.
