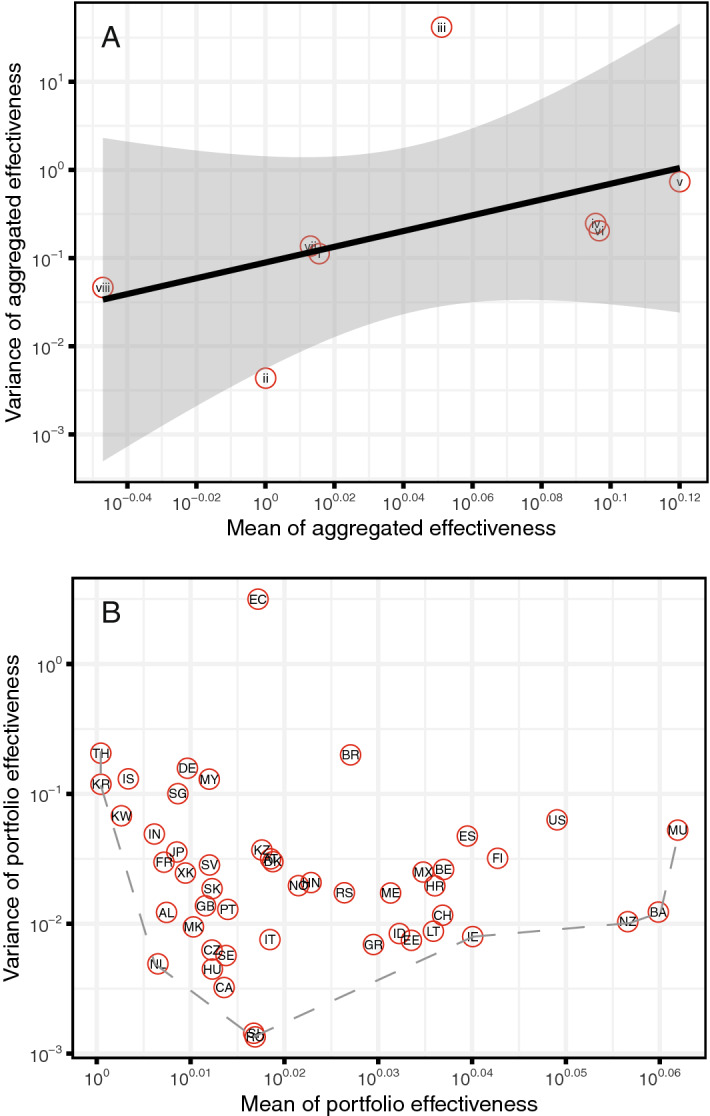
Figure 6.

Mean and variance of portfolio effectiveness for each NPI and for countries. (A) Mean and variance of aggregated effectiveness across time and countries; 8 themes are shown in red circles. The black line and gray area represent the regression line and corresponding confidence interval, respectively. Note that both axes are shown in log10-scale. (B) Mean and variance of portfolio effectiveness. 50 countries are shown in red circles with their ISO codes. The gray dashed line represents an empirical Pareto frontier where variance and mean of portfolio effectiveness is the risk level and the expected return, respectively. Note that both axes are shown in log10-scale.
