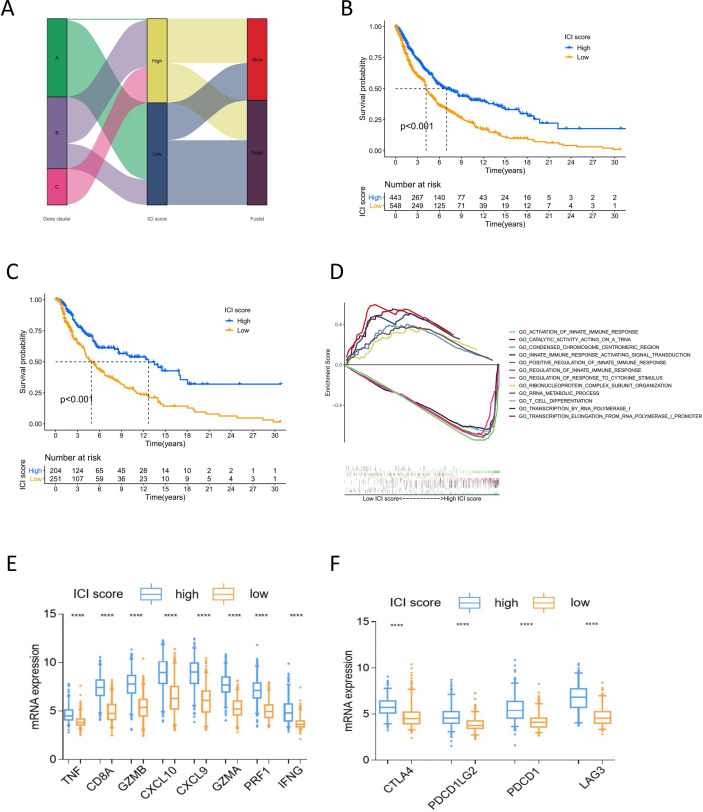
Figure 3.
Analysis of ICI score. (A) Alluvial diagram of ICI scores groups distribution in different gene cluster, and survival outcomes. (B) Kaplan-Meier curves of overall survival for high and low ICI score cluster in all sample. Log rank test P <0.001. (C) Kaplan-Meier curves of overall survival for high and low ICI score cluster in TCGA cohort. Log rank test P <0.001. (D) GSEA of high and low ICI score groups for all melanoma samples. (E) The box plot of immune activity related signature genes expression (CXCL9, CXCL10, TNF, IFNG, CD8A, GZMA, GZMB, PRF1) in high and low ICI score, ****P<0.0001. (F) The box plot of immune checkpoint signature genes expression (CTLA4, PDCD1, PDCD1LG2, LAG3) in high and low ICI score, ****P<0.0001.

