
Figure 3.
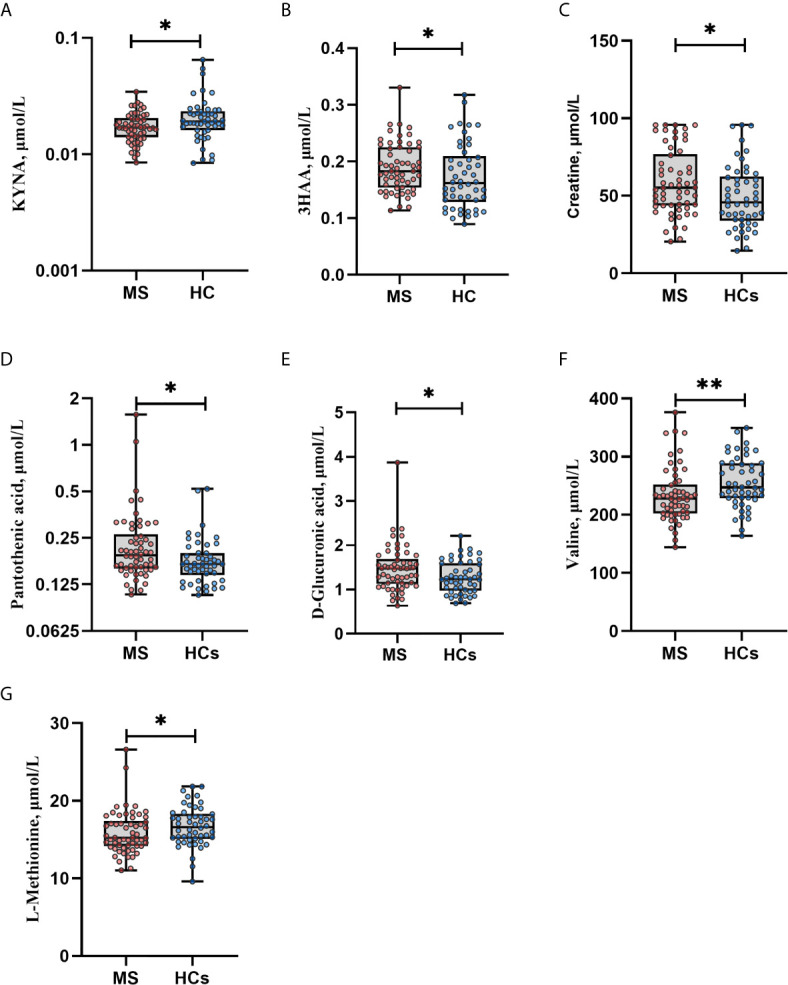
Metabolites in multiple sclerosis (MS) vs. healthy controls (HCs). (A) KYNA levels were lower in MS vs. HCs. (B) 3HAA levels were higher in MS vs. HCs. (C–E) MS patients had higher levels of creatine, pantothenic acid and D-glucuronic acid compared with HCs. (F–G) Levels of valine and l-methionine were lower in MS patients vs. HCs. *p<0.05, **p<0.01 by Mann Whitney U test. Data are median (IQR), minimum and maximum. Each dot represents individual values. After adjustment for multiple testing all q values became non-significant, q>0.05. Due to right-skewed distribution, logarithmic scales were used to display KYNA and pantothenic acid levels. KYNA, kynurenic acid; 3HAA, 3-hydroxyanthranilic acid.