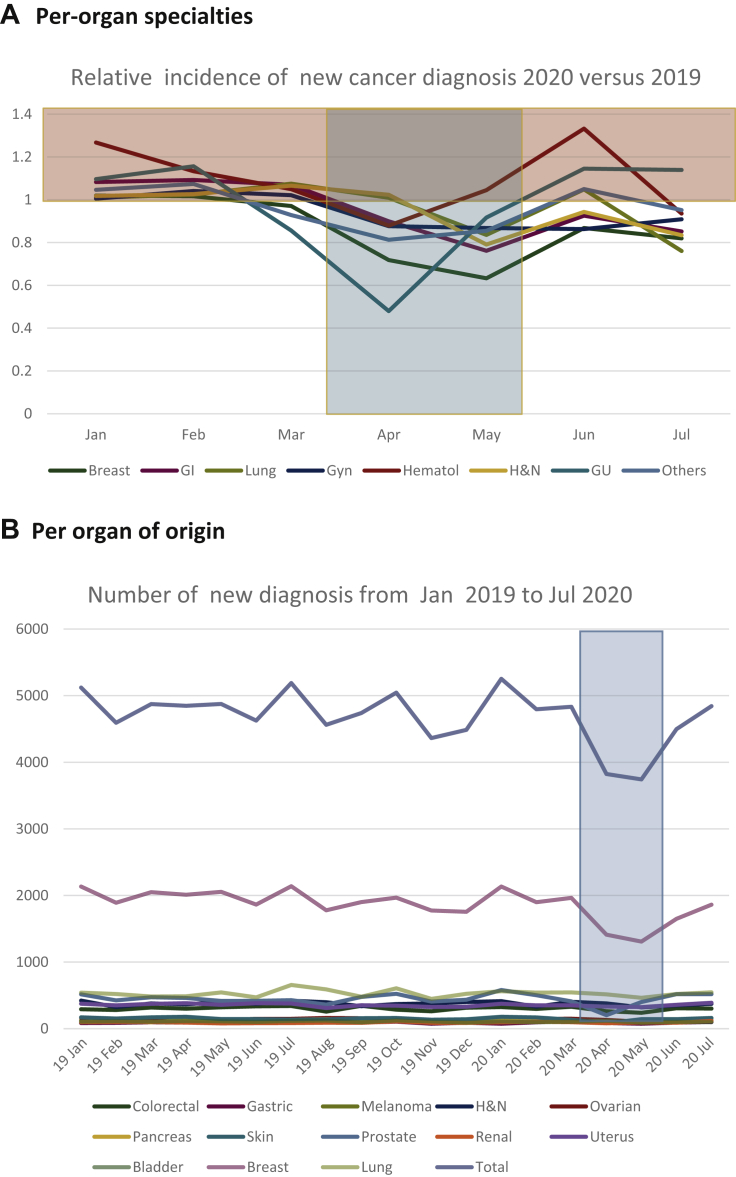
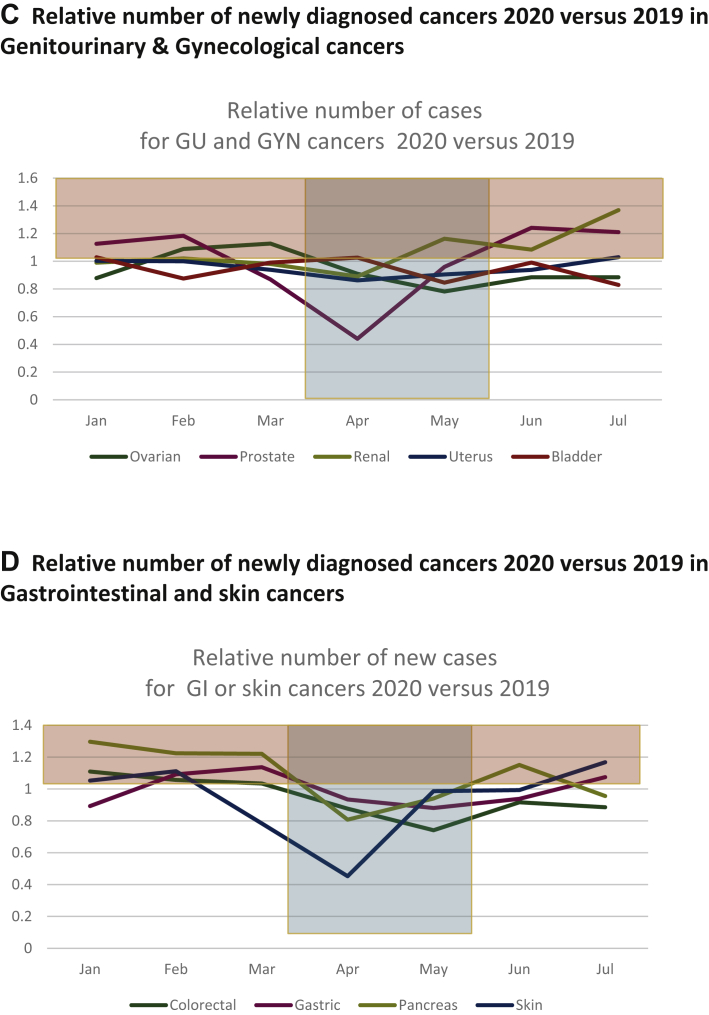
Figure 3.
Relative and absolute numbers of newly diagnosed cancers in 2020 versus 2019.
(A) Relative number of newly diagnosed patients with cancers of different organs and sites: x-axis: months of 2020; y-axis: relative proportion of newly diagnosed patients per month in 2020 versus 2019. Highlighted in blue: lockdown 1 period. Highlighted in yellow: higher number of newly diagnosed in patients in 2020 versus 2019. (B) Absolute number of newly diagnosed patients with cancers of different organs and sites: x-axis: months of 2020; y-axis: total number of newly diagnosed patients per month in 2020 versus 2019, for the different cancer types. Orange curve represents the total. Green curve represents breast cancers. (C) Relative number of newly diagnosed cancers in 2020 versus 2019: genitourinary and gynecological cancers. x-axis: months of 2020; y-axis: relative proportion of newly diagnosed patients per month in 2020 versus 2019. Highlighted in blue: lockdown 1 period. Highlighted in yellow: higher number of newly diagnosed patients in 2020 versus 2019. (D) Relative number of newly diagnosed cancers in 2020 versus 2019: gastrointestinal and skin cancers. x-axis: months of 2020, y-axis: relative proportion of newly diagnosed patients per month in 2020 versus 2019. Highlighted in blue: lockdown 1 period. Highlighted in yellow: higher number of new diagnosed in patients in 2020 versus 2019. GI, gastrointestinal; GU, genitourinary; Gyn, gynecological; H&N, head and neck; Hematol, hematological.


