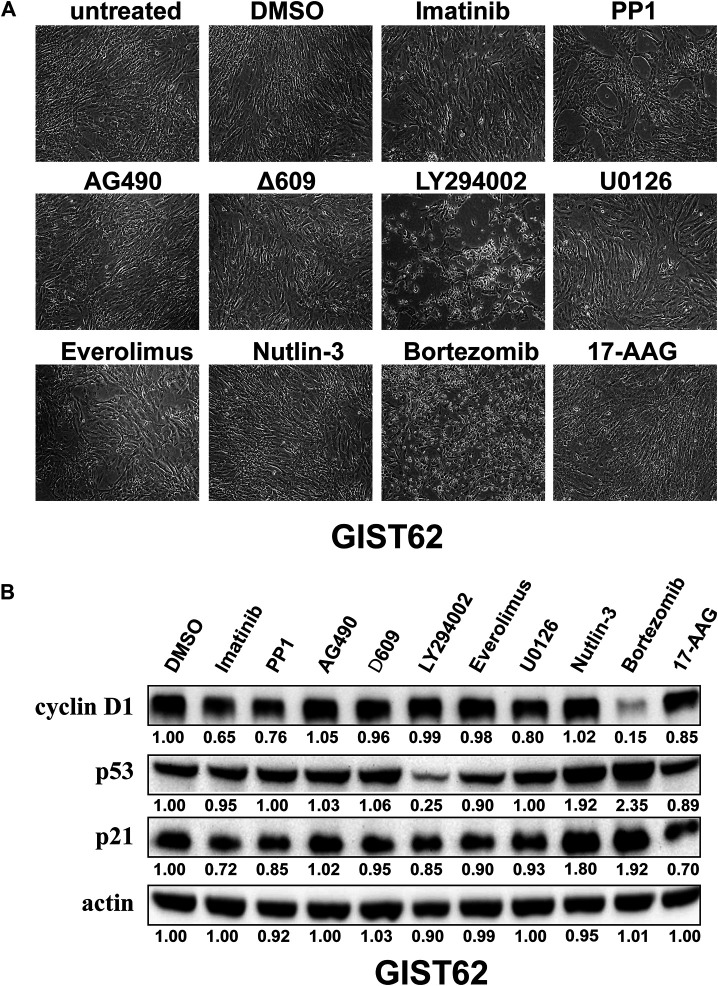
FIGURE 1.
(A) Cell growth was evaluated in KIT-independent GIST cell line (GIST62) after treatment with Imatinib (1 μM), PP1 (1 μM), AG490 (10 μM), Δ609 (1 μM), LY294002 (50 μM), U0126 (10 μM), Everolimus (1 μM), Nutlin-3 (5 μM), Bortezomib (100 nM), and 17-AAG (0.5 μM) for 72 h. (B) Immunoblotting evaluated expression of cyclin D1, p53, and p21 in GIST62 cells after treatment with the bortezomib for 72 h. Actin stain is a loading control. Linear capture quantitation of immunoblotting chemiluminescence signals, using an ImageQuant LAS4000. Intensity values are standardized to the DMSO control.

