FIGURE 3.

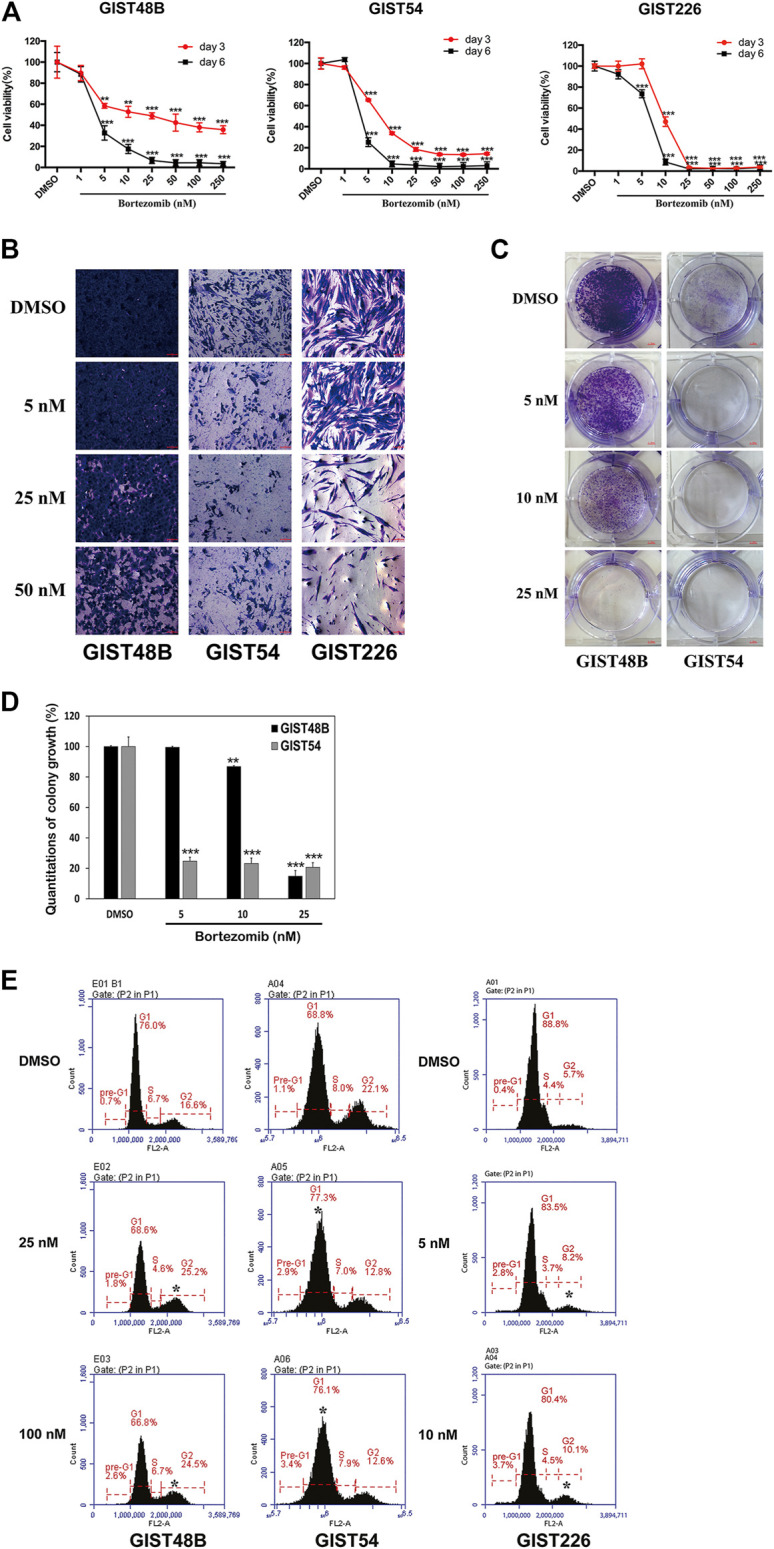
Anti-proliferative effects of bortezomib in KIT-independent GIST cell lines (GIST48B, GIST54, and GIST226) were assessed by cell viability, cell imaging, colony formation assays, and cell cycle analysis. (A) Cell viability was evaluated by MTT assays in GIST48B, GIST54, and GIST226 cell lines, 3 and 6 days after treatment with bortezomib (1, 5, 10, 25, 50, 100, and 250 nM). Data were normalized to DMSO control and represent the mean values (±s.d.) from quadruplicate cultures, and were averaged from two independent experiments. Statistically significant differences between DMSO control and bortezomib treatment are presented as **p < 0.01, ***p < 0.001. (B) Cell culture appearance of GIST48B, GIST54, and GIST226, when evaluated at 72, 48, and 48 h after treatment with bortezomib (5, 25, and 50 nM) and staining with crystal violet, showing dramatic growth inhibition compared to DMSO-treated control cultures. Scale bars: 100 μm. (C) Colony growth assays were performed at 7 days after treatment with bortezomib (5, 10, and 25 nM). Colony growth experiments were performed in triplicate. Bortezomib treatment led to a greater reduction in colony formation and size in GIST48B and GIST54 than the DMSO control. (D) Quantitation (A570) of GIST48B and GIST54 cell colony growth after treatment with bortezomib for 7 days. Statistically significant differences between untreated control and bortezomib treatments are presented as **p < 0.01, ***p < 0.001. (E) Cell cycle analysis was performed 72 h after treatment with bortezomib (25 and 100 nM). GIST48B, GIST54, and GIST226 showed a cell population increase in G1/G2-phase, accompanied by a decrease in G2/G1-and S-phase. Cell cycle experiments were performed in triplicate. Statistically significant differences between DMSO control and bortezomib treatment are presented as *p < 0.05.
