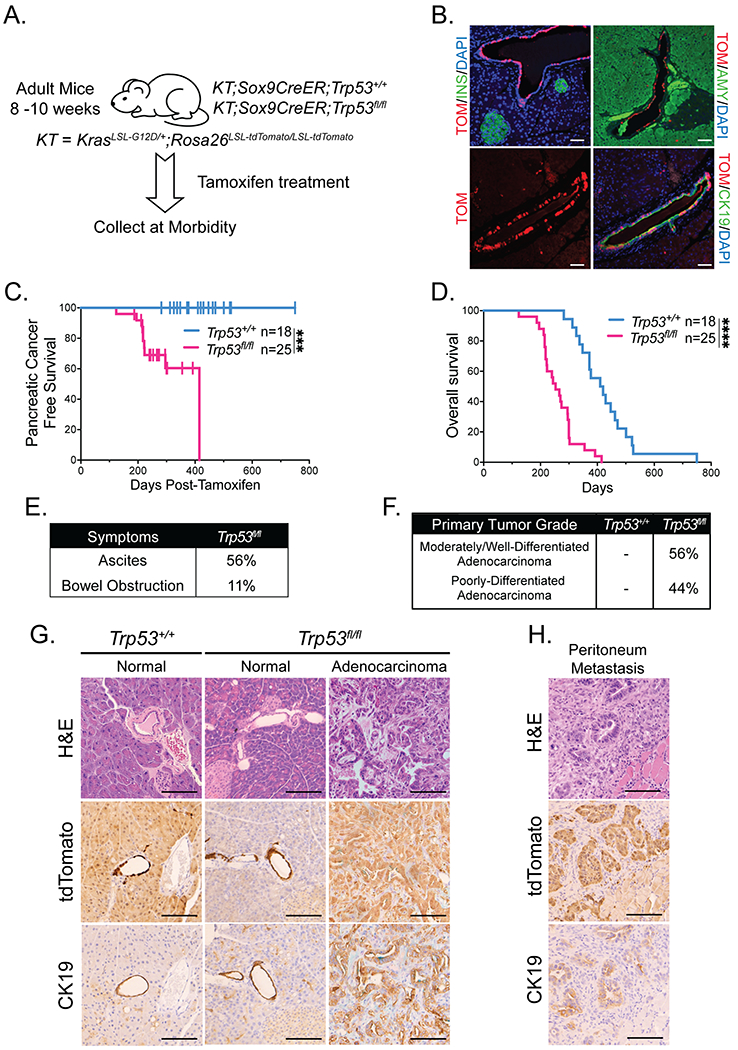
Figure 3. Pancreatic cancer can develop from adult mouse ductal cells.

(A) Schematic for ductal cell-derived pancreatic cancer study of KT;Sox9CreER;Trp53+/+and KT;Sox9CreER;Trp53fl/fl mouse cohorts. Mice were treated with tamoxifen for 3 consecutive days at 8-10 weeks of age, then aged to analyze survival.
(B) Representative co-immunofluorescence staining for tdTomato (TOM) and amylase (AMY; acinar cell marker), cytokeratin 19 (CK19; ductal cell marker), and insulin (INS; islet marker), in a Rosa26LSL-tdTomato/LSL-tdTomato;Sox9CreER;Trp53+/+ mouse pancreas 3 days after the last dose of tamoxifen (n = 4). DAPI stains nuclei. Scale Bar = 50 μm.
(C) Kaplan-Meier analysis of pancreatic cancer-free survival of cohorts listed in (A). Labels indicate the Trp53 status of each cohort. Pancreatic cancer-free survival in KT;Sox9CreER;Trp53fl/fl mice (n = 25) is significantly different from that of KT;Sox9CreER;Trp53+/+ mice (n = 18), based on the log-rank test. ***p-value < 0.001.
(D) Kaplan-Meier analysis of overall survival of cohorts listed in (A). Labels indicate the Trp53 status of each cohort. Overall survival in KT;Sox9CreER;Trp53fl/fl mice (n = 25) is significantly different from that of KT;Sox9CreER;Trp53+/+ mice (n = 18), based on the log-rank test. ****p-value < 0.0001.
(E) Table summarizing the percentages of pancreatic tumor-bearing KT;Sox9CreER;Trp53fl/fl mice presenting with clinical symptoms of pancreatic cancer (ascites and bowel obstruction) at morbidity (n = 9).
(F) Table summarizing the percentages of tumor-bearing KT;Sox9CreER;Trp53fl/fl mice (n = 9) with primary tumor grade (comprising > 50% of the tumor) of moderately/well-differentiated or poorly-differentiated adenocarcinomas. KT;Sox9CreER;Trp53+/+ mice (n = 18) had no evidence of pancreatic tumors.
(G) Representative histological images of typical pancreas morphology found in each cohort, analyzed by H&E staining and immunohistochemistry for tdTomato and CK19. Scale Bar = 100 μm.
(H) Representative image of a peritoneum metastasis in a KT;Sox9CreER;Trp53fl/fl mouse analyzed by H&E staining and immunohistochemistry for tdTomato and CK19. Scale Bar = 100 μm.
