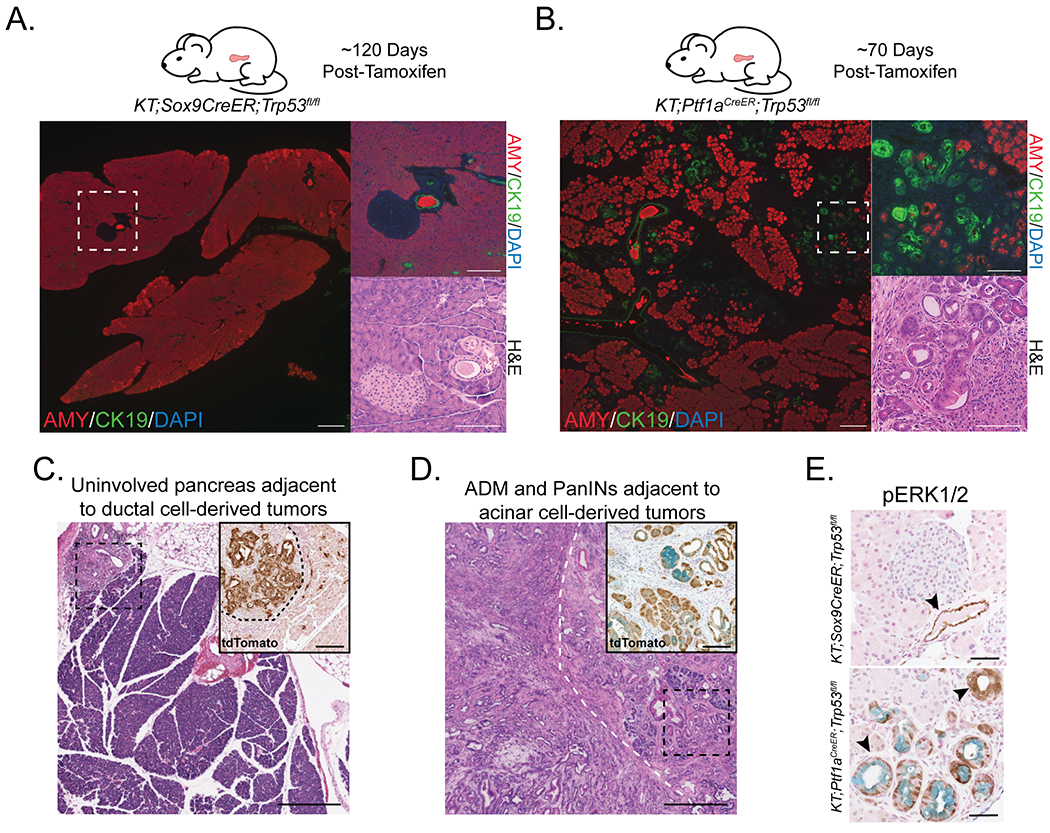
Figure 4. Analysis of the precursors in PDAC development from acinar and ductal cells.

(A) (Left) Representative histological image of pancreas in KT;Sox9CreER;Trp53fl/fl mouse at ~120 days post-tamoxifen analyzed by co-immunofluorescence for AMY (acinar cell marker) and CK19 (ductal cell marker; n = 6). DAPI stains nuclei. Scale Bar = 200 μm. (Right) High magnification image of area within dashed box by co-immunofluorescence and H&E staining. Scale Bar = 100 μm.
(B) Representative histological image of pancreas in KT;Ptf1aCreER;Trp53fl/fl mouse at ~70 days post-tamoxifen analyzed by co-immunofluorescence for AMY (acinar cell marker) and CK19 (ductal cell marker; n = 7). DAPI stains nuclei. Scale Bar = 200 μm. (Right) High magnification image of area within dashed box by co-immunofluorescence and H&E staining. Scale Bar = 100 μm.
(C) Representative histological image of a tumor found in a KT;Sox9CreER;Trp53fl/fl mouse analyzed by H&E staining. Scale Bar = 400 μm. (Inset) High magnification of area within dashed box analyzed by immunohistochemistry for tdTomato. Black dashed curved line separates tumor from non-tumor area. Scale Bar = 100 μm.
(D) Representative histological image of a tumor found in a KT;Ptf1aCreER;Trp53fl/fl mouse, analyzed by H&E staining. White dashed curved line roughly separates tumor from non-tumor area. Scale Bar = 400 μm. (Inset) High magnification of area within black dashed box analyzed by immunohistochemistry for tdTomato. Alcian blue staining indicates PanINs. Scale Bar = 100 μm.
(E) Representative phospho-ERK1/2 immunostaining of the pancreas in KT;Sox9CreER;Trp53fl/fl (n = 6) and KT;Ptf1aCreER;Trp53fl/fl (n = 7) mice at approximately 120 and 70 days, respectively, the midpoint of median survival. Alcian blue staining marks PanINs. Arrowheads denote an example of a phospho-ERK1/2 expressing duct, ADM, or PanIN. Scale Bar = 50 μm.
